St. Louis Area Real
This document was uploaded by user and they confirmed that they have the permission to share it. If you are author or own the copyright of this book, please report to us by using this DMCA report form. Report DMCA
Overview
Download & View St. Louis Area Real as PDF for free.
More details
- Words: 968
- Pages: 6
St. Louis Area Real MARKET UPDATE
SAINT PETERS, MO
· Current Real Estate Market Conditions for Single Family Homes · Trends in Pricing · Current Levels of Supply and Demand · Value Metrics
· Report for the week of September 21, 2009
· Presented by River City Real Estate River City Real Estate http://www.RCREonline.com Toll Free: (866) 456-1862 | www.rcreonline.com
Powered by Altos Research LLC | www.altosresearch.com | Copyright © 2005-2009 Altos Research LLC
City Overview River City Real Estate, Toll Free: (866) 456-1862 |
SAINT PETERS, MO
This Week
Real-Time Market Profile
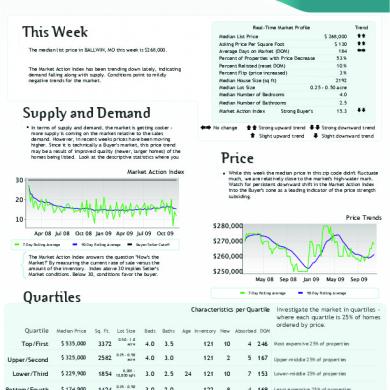
The median list price in SAINT PETERS, MO this week is $194,900. The 319 properties have been on the market for an average of 163 days.
Trend
Median List Price
$ 194,900
Average List Price
$ 233,732 $ 125
==
Average Days on Market (DoM)
163
==
Inventory of Properties Listed
319
≠≠
Asking Price Per Square Foot
Most Expensive Listing
Inventory has been lightening lately and the Market Action Index has been trending up. Though days-on-market is increasing, these are mildly positive indications for the market.
$ 1,600,000
Least Expensive Listing
$ 79,900
Average Age of Listing
26
Percent of Properties with Price Decrease
46 %
Percent Relisted (reset DOM)
11 %
Percent Flip (price increased)
2%
Median House Size (sq ft)
1613
Median Lot Size
Supply and Demand
==
8,001 - 10,000 sqft
Median Number of Bedrooms
3.0
Median Number of Bathrooms
2.5
Altos Research Value Statistics
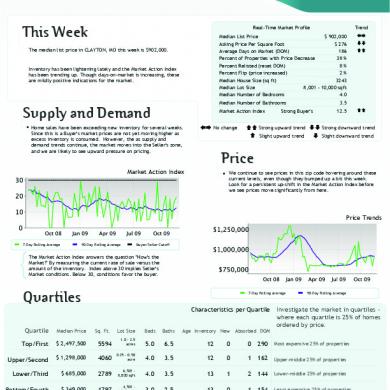
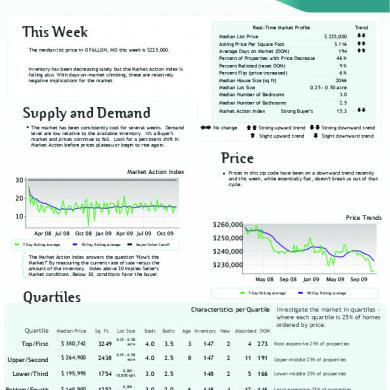
The market has shown some evidence of slowing recently. Both prices and inventory levels are relatively unchanged in recent weeks. Watch the Market Action Index for changes as it can be a leading indicator for price changes.
Market Action
Strong Buyer's
18.1
==
The Market Action Index answers the question "How's the Market?" By measuring the current rate of sale versus the amount of the inventory. Index above 30 implies a seller's advantage. Below 30, conditions give the advantage to the buyer.
Trend Key:
±+
== Strong upward = Slight upward
No change
≠≠ Strong downward ≠ Slight downward trend
Characteristics per Quartile Quartile
Median Price
Sq. Ft. Lot Size
Beds
Baths
Age Inventory New
Absorbed
DOM
Top/First
$ 329,900
2594
0.25 - 0.50 acre
4.0
2.5
10
79
2
5
225
Most expensive 25% of properties
Upper/Second
$ 230,000
2000
0.25 - 0.50 acre
3.0
2.5
13
80
8
9
178
Upper-middle 25% of properties
Lower/Third
$ 174,450
1417
8,001 10,000 sqft
3.0
2.5
28
80
13
12
131
Lower-middle 25% of properties
Bottom/Fourth
$ 141,000
1144
8,001 10,000 sqft
3.0
2.0
33
80
11
9
119
Least expensive 25% of properties
Thursday September 17, 2009
City Overview
SAINT PETERS, MO
River City Real Estate, Toll Free: (866) 456-1862 |
Median Price Despite this week's down tic, price trends in this zip code have generally been moving up lately. We are below the market's high point, and we'll investigate the Market Action Index later on to see if we expect this week's blip to become a downward trend.
7-day Average
90-day Average
Quartile Prices In the quartile market segments, we see prices in this zip code without strong directional indication lately. Quartiles 2 and 4 are mixed, while Quartile 3 is up and Quartile 1 is down. Look to persistent shifts in the Market Action Index as a leading indicator for strong moves (up or down) in the market as a whole.
First/Top
Second/Upper
Third/Lower
Thursday September 17, 2009
Fourth/Bottom
City Overview
SAINT PETERS, MO
River City Real Estate, Toll Free: (866) 456-1862 |
Price per Square Foot The market appears to be placing an increasing premium on homes. When list prices and price per square foot consistently increase in tandem, as they're doing now, you can often find short-term investment opportunities. Watch the Market Action Index for persistent changes as a leading indicator for these trends to flatten or drop.
7-day Average
90-day Average
Inventory of Properties Listed for Sale Inventory has been falling in recent weeks. Note that declining inventory alone does not signal a strengthening market. Look to the Market Action Index and Days on Market trends to gauge whether buyer interest is changing with the available supply.
7-day Average
90-day Average
Thursday September 17, 2009
City Overview
SAINT PETERS, MO
River City Real Estate, Toll Free: (866) 456-1862 |
Market Action Index The SAINT PETERS market is currently quite strongly in the Buyer's Advantage zone (below 30). The 90-day Market Action Index stands at 18.12. With several months of inventory available at the current sales rate, buyers should find ample choice.
90-day Average
Buyers/Sellers
Market Action Index per Quartile Not surprisingly, all quartiles are in the Buyer's Market zone with several months of inventory given the current levels of demand. Watch the quartiles for changes before the overall market shifts.
First/Top
Second/Upper
Third/Lower
Fourth/Bottom
Buyers/Sellers Cutoff Residential house prices are a function of supply and demand, and market conditions can be characterized by analyzing those factors. Watch this index for sustained changes: if the index falls into the Buyer’s Advantage zone (below 30) for a long period, prices are likely in for a downward correction. The Market Action Index (MAI) illustrates a blance between supply and demand using a statistical function of the current rate of sale versus current inventory. Thursday September 17, 2009
City Overview
SAINT PETERS, MO
River City Real Estate, Toll Free: (866) 456-1862 |
Days on Market The properties have been on the market for an average of 163 days. Half of the listings have come newly on the market in the past 98 or so days.
7-day Average
90-day Average
Days on Market per Quartile It is not uncommon for the higher priced homes in an area to take longer to sell than those in the lower quartiles.
First/Top
Second/Upper
Third/Lower
Thursday September 17, 2009
Fourth/Bottom
SAINT PETERS, MO
· Current Real Estate Market Conditions for Single Family Homes · Trends in Pricing · Current Levels of Supply and Demand · Value Metrics
· Report for the week of September 21, 2009
· Presented by River City Real Estate River City Real Estate http://www.RCREonline.com Toll Free: (866) 456-1862 | www.rcreonline.com
Powered by Altos Research LLC | www.altosresearch.com | Copyright © 2005-2009 Altos Research LLC
City Overview River City Real Estate, Toll Free: (866) 456-1862 |
SAINT PETERS, MO
This Week
Real-Time Market Profile
The median list price in SAINT PETERS, MO this week is $194,900. The 319 properties have been on the market for an average of 163 days.
Trend
Median List Price
$ 194,900
Average List Price
$ 233,732 $ 125
==
Average Days on Market (DoM)
163
==
Inventory of Properties Listed
319
≠≠
Asking Price Per Square Foot
Most Expensive Listing
Inventory has been lightening lately and the Market Action Index has been trending up. Though days-on-market is increasing, these are mildly positive indications for the market.
$ 1,600,000
Least Expensive Listing
$ 79,900
Average Age of Listing
26
Percent of Properties with Price Decrease
46 %
Percent Relisted (reset DOM)
11 %
Percent Flip (price increased)
2%
Median House Size (sq ft)
1613
Median Lot Size
Supply and Demand
==
8,001 - 10,000 sqft
Median Number of Bedrooms
3.0
Median Number of Bathrooms
2.5
Altos Research Value Statistics
The market has shown some evidence of slowing recently. Both prices and inventory levels are relatively unchanged in recent weeks. Watch the Market Action Index for changes as it can be a leading indicator for price changes.
Market Action
Strong Buyer's
18.1
==
The Market Action Index answers the question "How's the Market?" By measuring the current rate of sale versus the amount of the inventory. Index above 30 implies a seller's advantage. Below 30, conditions give the advantage to the buyer.
Trend Key:
±+
== Strong upward = Slight upward
No change
≠≠ Strong downward ≠ Slight downward trend
Characteristics per Quartile Quartile
Median Price
Sq. Ft. Lot Size
Beds
Baths
Age Inventory New
Absorbed
DOM
Top/First
$ 329,900
2594
0.25 - 0.50 acre
4.0
2.5
10
79
2
5
225
Most expensive 25% of properties
Upper/Second
$ 230,000
2000
0.25 - 0.50 acre
3.0
2.5
13
80
8
9
178
Upper-middle 25% of properties
Lower/Third
$ 174,450
1417
8,001 10,000 sqft
3.0
2.5
28
80
13
12
131
Lower-middle 25% of properties
Bottom/Fourth
$ 141,000
1144
8,001 10,000 sqft
3.0
2.0
33
80
11
9
119
Least expensive 25% of properties
Thursday September 17, 2009
City Overview
SAINT PETERS, MO
River City Real Estate, Toll Free: (866) 456-1862 |
Median Price Despite this week's down tic, price trends in this zip code have generally been moving up lately. We are below the market's high point, and we'll investigate the Market Action Index later on to see if we expect this week's blip to become a downward trend.
7-day Average
90-day Average
Quartile Prices In the quartile market segments, we see prices in this zip code without strong directional indication lately. Quartiles 2 and 4 are mixed, while Quartile 3 is up and Quartile 1 is down. Look to persistent shifts in the Market Action Index as a leading indicator for strong moves (up or down) in the market as a whole.
First/Top
Second/Upper
Third/Lower
Thursday September 17, 2009
Fourth/Bottom
City Overview
SAINT PETERS, MO
River City Real Estate, Toll Free: (866) 456-1862 |
Price per Square Foot The market appears to be placing an increasing premium on homes. When list prices and price per square foot consistently increase in tandem, as they're doing now, you can often find short-term investment opportunities. Watch the Market Action Index for persistent changes as a leading indicator for these trends to flatten or drop.
7-day Average
90-day Average
Inventory of Properties Listed for Sale Inventory has been falling in recent weeks. Note that declining inventory alone does not signal a strengthening market. Look to the Market Action Index and Days on Market trends to gauge whether buyer interest is changing with the available supply.
7-day Average
90-day Average
Thursday September 17, 2009
City Overview
SAINT PETERS, MO
River City Real Estate, Toll Free: (866) 456-1862 |
Market Action Index The SAINT PETERS market is currently quite strongly in the Buyer's Advantage zone (below 30). The 90-day Market Action Index stands at 18.12. With several months of inventory available at the current sales rate, buyers should find ample choice.
90-day Average
Buyers/Sellers
Market Action Index per Quartile Not surprisingly, all quartiles are in the Buyer's Market zone with several months of inventory given the current levels of demand. Watch the quartiles for changes before the overall market shifts.
First/Top
Second/Upper
Third/Lower
Fourth/Bottom
Buyers/Sellers Cutoff Residential house prices are a function of supply and demand, and market conditions can be characterized by analyzing those factors. Watch this index for sustained changes: if the index falls into the Buyer’s Advantage zone (below 30) for a long period, prices are likely in for a downward correction. The Market Action Index (MAI) illustrates a blance between supply and demand using a statistical function of the current rate of sale versus current inventory. Thursday September 17, 2009
City Overview
SAINT PETERS, MO
River City Real Estate, Toll Free: (866) 456-1862 |
Days on Market The properties have been on the market for an average of 163 days. Half of the listings have come newly on the market in the past 98 or so days.
7-day Average
90-day Average
Days on Market per Quartile It is not uncommon for the higher priced homes in an area to take longer to sell than those in the lower quartiles.
First/Top
Second/Upper
Third/Lower
Thursday September 17, 2009
Fourth/Bottom
Related Documents

St. Louis Area Real
June 2020 8