St. Louis Area Real Estate Market Reports Executive Summary
This document was uploaded by user and they confirmed that they have the permission to share it. If you are author or own the copyright of this book, please report to us by using this DMCA report form. Report DMCA
Overview
Download & View St. Louis Area Real Estate Market Reports Executive Summary as PDF for free.
More details
- Words: 431
- Pages: 1
Monday November 30, 2009
St. Louis Area Real Estate Market Reports Executive Summary
CLAYTON, MO Single Family Homes
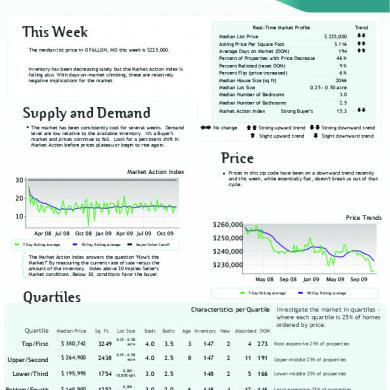
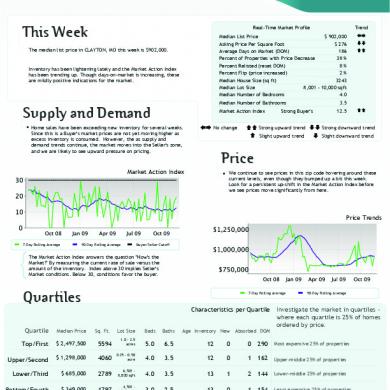
This Week The median list price in CLAYTON, MO this week is $902,000.
Inventory has been lightening lately and the Market Action Index has been trending up. Though days-on-market is increasing, these are mildly positive indications for the market.
Real-Time Market Profile
Trend
Median List Price $ 902,000 Asking Price Per Square Foot $ 276 Average Days on Market (DOM) 186 Percent of Properties with Price Decrease 38 % Percent Relisted (reset DOM) 8% Percent Flip (price increased) 2% Median House Size (sq ft) 3243 Median Lot Size 8,001 - 10,000 sqft Median Number of Bedrooms 4.0
±+ ≠≠ ==
Median Number of Bathrooms
Supply and Demand
Market Action Index
Home sales have been exceeding new inventory for several weeks. Since this is a Buyer's market prices are not yet moving higher as excess inventory is consumed. However, the as supply and demand trends continue, the market moves into the Seller's zone, and we are likely to see upward pressure on pricing.
±+
No change
3.5
Strong Buyer's
12.5
==
== Strong upward trend ≠≠ Strong downward trend = Slight upward trend ≠ Slight downward trend
Price
Market Action Index
We continue to see prices in this zip code hovering around these current levels, even though they bumped up a bit this week. Look for a persistent up-shift in the Market Action Index before we see prices move significantly from here.
Price Trends
7-Day Rolling Average
90-Day Rolling Average
Buyer/Seller Cutoff
The Market Action Index answers the question "How's the Market?" By measuring the current rate of sale versus the amount of the inventory. Index above 30 implies Seller's Market conditions. Below 30, conditions favor the buyer.
Quartiles
7-Day Rolling Average
Characteristics per Quartile Quartile
Median Price
Sq. Ft.
Top/First
$ 2,497,500
5594
Upper/Second
$ 1,298,000
Lower/Third Bottom/Fourth
Lot Size
90-Day Rolling Average
Investigate the market in quartiles where each quartile is 25% of homes ordered by price.
Beds
Baths
Age Inventory New Absorbed DOM
1.0 - 2.5 acres
5.0
6.5
12
0
0
290
Most expensive 25% of properties
4060
0.25 - 0.50 acre
4.0
3.5
12
0
1
162
Upper-middle 25% of properties
$ 685,000
2789
6,501 8,000 sqft
4.0
3.5
13
1
2
144
Lower-middle 25% of properties
$ 349,000
1797
4,501 6,500 sqft
3.0
2.5
13
0
1
154
Least expensive 25% of properties
River City Real Estate, Toll Free: (866) 456-1862 | www.RCREonline.com | [email protected]
Powered by Altos Research LLC | www.altosresearch.com | Copyright ©2009 Altos Research LLC
St. Louis Area Real Estate Market Reports Executive Summary
CLAYTON, MO Single Family Homes
This Week The median list price in CLAYTON, MO this week is $902,000.
Inventory has been lightening lately and the Market Action Index has been trending up. Though days-on-market is increasing, these are mildly positive indications for the market.
Real-Time Market Profile
Trend
Median List Price $ 902,000 Asking Price Per Square Foot $ 276 Average Days on Market (DOM) 186 Percent of Properties with Price Decrease 38 % Percent Relisted (reset DOM) 8% Percent Flip (price increased) 2% Median House Size (sq ft) 3243 Median Lot Size 8,001 - 10,000 sqft Median Number of Bedrooms 4.0
±+ ≠≠ ==
Median Number of Bathrooms
Supply and Demand
Market Action Index
Home sales have been exceeding new inventory for several weeks. Since this is a Buyer's market prices are not yet moving higher as excess inventory is consumed. However, the as supply and demand trends continue, the market moves into the Seller's zone, and we are likely to see upward pressure on pricing.
±+
No change
3.5
Strong Buyer's
12.5
==
== Strong upward trend ≠≠ Strong downward trend = Slight upward trend ≠ Slight downward trend
Price
Market Action Index
We continue to see prices in this zip code hovering around these current levels, even though they bumped up a bit this week. Look for a persistent up-shift in the Market Action Index before we see prices move significantly from here.
Price Trends
7-Day Rolling Average
90-Day Rolling Average
Buyer/Seller Cutoff
The Market Action Index answers the question "How's the Market?" By measuring the current rate of sale versus the amount of the inventory. Index above 30 implies Seller's Market conditions. Below 30, conditions favor the buyer.
Quartiles
7-Day Rolling Average
Characteristics per Quartile Quartile
Median Price
Sq. Ft.
Top/First
$ 2,497,500
5594
Upper/Second
$ 1,298,000
Lower/Third Bottom/Fourth
Lot Size
90-Day Rolling Average
Investigate the market in quartiles where each quartile is 25% of homes ordered by price.
Beds
Baths
Age Inventory New Absorbed DOM
1.0 - 2.5 acres
5.0
6.5
12
0
0
290
Most expensive 25% of properties
4060
0.25 - 0.50 acre
4.0
3.5
12
0
1
162
Upper-middle 25% of properties
$ 685,000
2789
6,501 8,000 sqft
4.0
3.5
13
1
2
144
Lower-middle 25% of properties
$ 349,000
1797
4,501 6,500 sqft
3.0
2.5
13
0
1
154
Least expensive 25% of properties
River City Real Estate, Toll Free: (866) 456-1862 | www.RCREonline.com | [email protected]
Powered by Altos Research LLC | www.altosresearch.com | Copyright ©2009 Altos Research LLC