Test Of Hyp Formula & Probs.docx
This document was uploaded by user and they confirmed that they have the permission to share it. If you are author or own the copyright of this book, please report to us by using this DMCA report form. Report DMCA
Overview
Download & View Test Of Hyp Formula & Probs.docx as PDF for free.
More details
- Words: 3,842
- Pages: 12
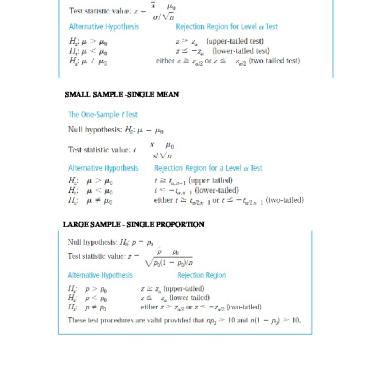
LARGE SAMPLE -SINGLE MEAN
SMALL SAMPLE -SINGLE MEAN
LARGE SAMPLE - SINGLE PROPORTION
SMALL SAMPLE - DIFFERENCE OF MEANS
LARGE SAMPLE DIFFERENCE OF MEANS
LARGE SAMPLE - DIFFERENCE OF PROPORTIONS
SMALL SAMPLE - DIFFERENCE OF VARIANCES
GODNESS OF FIT - UNIFORMITY TEST
CHI SQUARE TEST FOR HOMEGENEITY
EXECISE PROBLEMS LARGE SAMPLE PROBLEMS SINGLE MEAN 1. A melting point test of n = 40 samples of a binder used in manufacturing a rocket propellant resulted in 𝑥̅ = 154.2°F. Assume that the melting point is normally distributed with σ = 1.5°F. Test H0 :μ = 155 versus H1:μ ≠ 155 using α = 0.01. 2. The number of concurrent users for some internet service provider has always averaged 5000 with a standard deviation of 800. After an equipment upgrade, the average number of users at 100 randomly selected moments of time is 5200. Does it indicate, at a 5%
level of significance, that the mean number of concurrent users has increased? Assume that the standard deviation of the number of concurrent users has not changed. 3. The life in hours of a battery is known to be approximately normally distributed with standard deviation σ = 1.25 hours. A random sample of 50 batteries has a mean life of 𝑥̅ = 40.5 hours.Is there evidence to support the claim that battery life exceeds 40 hours? Use α = 0.05. 4. A manufacturer is interested in the output voltage of a power supply used in a PC. Output voltage is assumed to be normally distributed with standard deviation 0.25 volt, and the manufacturer wishes to test H0: μ = 5 volts against H1: μ ≠ 5 volts, using n = 600units. Find the power of the test for detecting a true mean output voltage of 5.1 volts at 5% l.o.s. 5. A manufacturer produces crankshafts for an automobile engine. The crankshafts wear after 100,000 miles is of interest because it is likely to have an impact on warranty claims. A random sample of n = 35 shafts is tested and x = 2.78. It is known that σ = 0.9 and that wear is normally distributed. Test H0 : μ = 3 versus H1: μ ≠ 3 using α = 0.05. 6. A melting point test of n = 40 samples of a binder used in manufacturing a rocket propellant resulted in x = 154.2°F. Assume that the melting point is normally distributed with σ = 1.5°F. Test H0 :μ = 155 versus H1:μ ≠ 155 using α = 0.01. 7. An engineer who is studying the tensile strength of a steel alloy intended for use in golf club shafts knows that tensile strength is approximately normally distributed with σ = 60 psi. A random sample of 42 specimens has a mean tensile strength of x = 3450 psi. Test the hypothesis that mean strength is 3500 psi. Use α = 0.01. 8. A bearing used in an automotive application is supposed to have a nominal inside diameter of 1.5 inches. A random sample of 200 bearings is selected, and the average inside diameter of these bearings is 1.4975 inches. Bearing diameter is known to be normally distributed with standard deviation σ = 0.01 inch. (a) Test the hypothesis H0:μ = 1.5 versus H1:μ ≠ 1.5 using α = 0.01. 9. A manufacturer is interested in the output voltage of a power supply used in a PC. Output voltage is assumed to be normally distributed with standard deviation 0.25 volt, and the manufacturer wishes to test H0: μ = 5 volts against H1: μ ≠ 5 volts, using n = 600units. Find the power of the test for detecting a true mean output voltage of 5.1 volts at 5% l.o.s. 10. The output voltage for an electric circuit is specified to be 130. A sample of 40 independent readings on the voltage for this circuit gave a sample mean 128.6 and standard deviation 2.1. Test the hypothesis that the average output voltage is 130 against the alternative that it is less than 130. Use a test with level .05. SINGLE PROPORTION
1. A manufacturer of interocular lenses will qualify a new grinding machine if there is evidence that the percentage of polished lenses that contain surface defects is 2%. A random sample of 250 lenses contains 6 defective lenses. Formulate and test an appropriate set of hypotheses to determine whether the machine can be qualified. Use α = 0.05. 2. A researcher claims that at least 10% of all football helmets have manufacturing flaws that could potentially cause injury to the wearer. A sample of 200 helmets revealed that 16 helmets contained such defects. Does this finding support the researcher's claim? Use α = 0.01. 3. A cell phone company claim that 84% of batteries for cell phones will not discharged fully in 48 operating hours with proper charging procedures. A study of 5000 batteries is carried out and 15 stop operating prior to 48 hours. Do these experimental results support the claim of cell phone company at 5% i.o.s. 4. A semiconductor manufacturer produces controllers used in automobile engine applications. The customer requires that the process fallout or fraction defective at a critical manufacturing step not exceed 0.05 and that the manufacturer demonstrate process capability at this level of quality using α = 0.05. The semiconductor manufacturer takes a random sample of 200 devices and finds that four of them are defective. Can the manufacturer demonstrate process capability for the customer? 5. A computer manufacturer ships laptop computers with the batteries fully charged so that customers can begin to use their purchases right out of the box. In its last model, 85% of customers received fully charged batteries. To simulate arrivals, the company shipped 100 new model laptops to various company sites around the country. Of the 105 laptops shipped, 96 of them arrived reading 100% charged. Do the data provide evidence that this model’s rate is at least as high as the previous model? Test the hypothesis at α = 0.05. TWO MEANS 1. Two types of plastic are suitable for an electronics component manufacturer to use. The breaking strength of this plastic is important. It is known that σ1 = σ2 = 1.0 psi. From a ̅̅̅ = 162.5 and 𝑥2 ̅̅̅= 155.0. The random sample of size n1 = 100 and n2 = 120, you obtain 𝑥1 company will not adopt plastic 1 unless its mean breaking strength exceeds that of plastic 2 by at least 10 psi. Based on the sample information, should it use plastic 1? Use α = 0.05 in reaching a decision. 2. A product developer is interested in reducing the drying time of a primer paint. Two formulations of the paint are tested; formulation 1 is the standard chemistry, and formulation 2 has a new drying ingredient that should reduce the drying time. From experience, it is known that the standard deviation of drying time is 8 minutes, and this inherent variability should be unaffected by the addition of the new ingredient. Ten specimens are painted with formulation 1, and another 40 specimens are painted with
formulation 2; the 50 specimens are painted in random order. The two sample average ̅̅̅ = 121 minutes and 𝑥2 ̅̅̅ = 112 minutes, respectively. What drying times are 𝑥1 conclusions can the product developer draw about the effectiveness of the new ingredient, using α = 0.05? 3. CD writing is energy consuming; therefore, it affects the battery lifetime on laptops. To estimate the effect of CD writing, 35 users are asked to work on their laptops until the “low battery” sign comes on. Those users without a CD writer worked an average of 5.3 hours with a standard deviation of 1.4 hours. The other 45, who used their CD writer, worked an average of 4.8 hours with a standard deviation of 1.6 hours. Does a CD writer consume extra energy, and therefore, does it reduce the battery life on a laptop? Take l.o.s 5% 4. Tensile strength tests were performed on two different grades of aluminum spars used in manufacturing the wing of a commercial transport aircraft. From past experience with the spar manufacturing process and the testing procedure, the standard deviations of tensile strengths are assumed to be known. The data obtained are as follows: n1 = 40, ̅̅̅ 𝑥1 = 87.6, ̅̅̅ σ1 = 1, n2 = 42, 𝑥2 = 74.5, and σ2 = 1.5. Is there any difference in two grades of aluminum spars at 5% i.o.s. 5. A polymer is manufactured in a batch chemical process. Viscosity measurements are normally made on each batch, and long experience with the process has indicated that the variability in the process is fairly stable with σ = 20. Thirty five samples have average viscosity 756, while another batch of Forty three samples have average viscosity 791.Is there any difference in mean viscosity at 1% i.o.s. TWO PROPORTIONS 1. Two different types of injection-molding machines are used to form plastic parts. A part is considered defective if it has excessive shrinkage or is discolored. Two random samples, each of size 300, are selected, and 15 defective parts are found in the sample from machine 1, and 8 defective parts are found in the sample from machine 2. Is it reasonable to conclude that machine 2 produce less fraction of defective parts, using α = 0.05? 2. Two different types of polishing solutions are being evaluated for possible use in a tumble-polish operation for manufacturing interocular lenses used in the human eye following cataract surgery. Three hundred lenses were tumble polished using the first polishing solution, and of this number, 253 had no polishing-induced defects. Another 300 lenses were tumble-polished using the second polishing solution, and 196 lenses were satisfactory upon completion. Is there any reason to believe that the two polishing solutions differ? Use α = 0.01.
3. Out of two weighing machines at a railway station 1st Machine fails to work 13 times in 250 trials. The 2nd Machine fails to work in 7 times in 200 trials. Can we conclude that second machine failure proportion is less at 5% L.O.S 4. A quality inspector finds 10 defective parts in a sample of 500 parts received from manufacturer A. Out of 400 parts from manufacturer B, she finds 12 defective ones. A computer-making company uses these parts in their computers and claims that the quality of parts produced by A and B is the same. At the 5% level of significance, do we have enough evidence to disprove this claim? 5. A random sample of 10000 men shows that 8267 favour alliance of DMDK with ADMK while 10000 women shows that 7824 fvaour the alliance of DMDK with ADMK. Is there any difference in opinion at 5% i.o.s. SMALL SAMPLE TEST Single Mean 1. High sulfur content in steel is very undesirable, giving corrosion problems among other disadvantages. If the sulfur content becomes too high, steps have to be taken. Five successive independent specimens in a steel-making process give values of percentage sulfur of 0.0307, 0.0324, 0.0314, 0.0311 and 0.0307. Do these data give evidence at the 5% level of significance that the true mean percentage sulfur is above 0.0300. 2. Two chemical processes for manufacturing the same product are being compared under the same conditions. Yield from Process A gives an average value of 96.2 from six runs, and the estimated standard deviation of yield is 2.75. Yield from Process B gives an average value of 93.3 from seven runs, and the estimated standard deviation is 3.35. Yields follow a normal distribution. Is the difference between the mean yields statistically significant? Use the 5% level of significance, and show rejection regions for the difference of mean yields on a sketch. 3. The average daily amount of scrap from a particular manufacturing process is 25.5 kg with a standard deviation of 1.6 kg. A modification of the process is tried in an attempt to reduce this amount. During a 10-day trial period, the kilograms of scrap produced each day were: 25.0, 21.9, 23.5, 25.2, 22.0, 23.0, 24.5, 25.0, 26.1, 22.8. From the nature of the modification, no change in day-to-day variability of the amount of scrap will result. The normal distribution will apply. A first glance at the figures suggests that the modification is effective in reducing the scrap level. Does a significance test confirm this at the 1% level? 4. The standard deviation of a particular dimension on a machine part is known to be 0.0053 inches. Four parts coming off the production line are measured, giving readings of 2.747, 2.740, 2.750 and 2.749 inches. The population mean is supposed to be 2.740 inches. The normal distribution applies. Is the sample mean significantly larger than 2.740 inches at the 1% level of significance? 5. A manufacturer of fluorescent lamps claims that his lamps have an average luminous flux of 3,600 lm at rated voltage and frequency and that 90% of all lamps produced by an automatic process have a luminous flux higher than 3,300 lm. The luminous flux of the lamps follows a normal distribution. What standard deviation is implied by the manufacturer’s claim? Assume that this standard deviation does not change. A random sample of l0 lamps is tested and
gives a sample mean of 3,470 lm. At the 5% level of significance can we conclude that the mean luminous flux is significantly less than what the manufacturer claims? State your null hypothesis and alternative hypothesis.
Difference of Means 1. Two companies produce resistors with a nominal resistance of 4000 ohms. Resistors from company A give a sample of size 9 with sample mean 4025 ohms and estimated standard deviation 42.6 ohms. A shipment from company B gives a sample of size l3 with sample mean 3980 ohms and estimated standard deviation 30.6 ohms. Resistances are approximately normally distributed. At 5% level of significance, is there a difference in the mean values of the resistors produced by the two companies? 2. A new composition for car tires has been developed and is being compared with an older composition. Ten tires are manufactured from the new composition, and ten are manufactured from the old composition. One tire of the new composition and one of the old compositions are placed on the front wheels of each of ten cars. Which composition goes on the left-hand or righthand wheel is determined randomly. The wheels are properly aligned. Each car is driven 60,000 km under a variety of driving conditions. Then the wear on each tire is measured. The results are: Do the results show at the 1% level of significance that the new composition gives significantly Car No. 1 2 3 4 5 6 7 8 9 10 Wear of 2.4 1.3 4.2 3.8 2.8 4.7 3.2 4.8 3.8 2.9 New Composition Wear of Old 2.7 1.9 4.3 4.2 3.0 4.8 3.8 5.3 3.7 3.1 Composition less wear than the old composition? 3. Nine specimens of unalloyed steel were taken and each was halved, one half being sent for analysis to a laboratory at Delhi and the other half to a laboratory at Bangalore. The determinations of percentage carbon content were as follows: Specimen l 2 3 4 5 6 7 8 9 No. Delhi Lab 0.22 0.ll 0.46 0.32 0.27 0.l9 0.08 0.l2 0.l8 Bangalore 0.20 0.l0 0.39 0.34 0.23 0.l4 0.l3 0.08 0.l6 Lab Is there any significant difference in mean carbon content tested by two labs at 1% l.o.s. 4. Two flow meters, A and B, are used to measure the flow rate of brine in a potash processing plant. The two meters are identical in design and calibration and are mounted on two adjacent pipes, A on pipe 1 and B on pipe 2. On a certain day, the following flow rates (in m3/sec) were observed at 10-minute intervals from 1:00 p.m. to 2:00 p.m.
Meter A Meter B 1:00 p.m. 1.7 2.0 1:10 p.m. 1.6 1.8 1:20 p.m. 1.5 1.6 1:30 p.m. 1.4 1.3 1:40 p.m. 1.5 1.6 1:50 p.m. 1.6 1.7 2:00 p.m, 1.7 1.9 Is the flow in pipe 2 significantly different from the flow in pipe 1 at the 5% level of significance? 5. Slaked lime is added to the furnace of an electric power station to reduce the production of SO2 (a major cause of acid rain). Extensive previous data showed that a standard method of adding slaked lime reduced SO2 emission by an average percentage of 31.0 with a standard deviation of 4.70. A test on a new method gives mean percentage removed of 33.5 based on a sample of size 15 with no change in the standard deviation. Is there evidence at the 1% level of significance that the new method gives higher removal of SO2 than the standard method? F- Test 1. Two different lighting techniques are compared by measuring the intensity of light at selected locations in areas lighted by the two methods. If 15 measurements in the first area had a SD of 2.7 foot-candles and 21 measurements in the second area had a SD of 4.2 foot-candles, can it be concluded that the lighting in the second area is less uniform? Use 5% LOS 2. Two different lighting techniques are compared by measuring the intensity of light at selected locations in areas lighted by the two methods. If 15 measurements in the first area had a SD of 2.7 foot-candles and 21 measurements in the second area had a SD of 4.2 foot-candles, can it be concluded that the lighting in the second area is less uniform? Use 5% LOS. 3. The following are the Brinell hardness values obtained for samples of two magnesium alloys before testing. Alloy 1: 66.3 63.5 64.9 61.8 64.3 64.7 65.1 64.5 68.4 63.2 Alloy 2: 71.3 60.4 62.6 63.9 68.8 70.1 64.8 68.9 65.8 66.2 Test whether the two samples came from same normal population. 4. The coefficients of thermal expansion of two alloys, A and B, are compared. Six random measurements are made for each alloy. For alloy A, the coefficients (×106) are 12.95, 14.05, 12.75, 12.10, 13.50 and 13.00. Coefficients (×106) for alloy B are 14.05, 15.35, 14.35, 15.15, 13 85 and 14.25. Assume the values for each alloy are normally distributed. Is the variance of coefficients for alloy A significantly different from the variance of coefficients for alloy B? Use the 10% level of significance. 5. The standard way of measuring water suction in soil is by a tensiometer. A new instrument for measuring this parameter is an electrical resistivity probe. A purchaser is interested in the variability of the readings given by the new instrument. The purchaser put both instruments into a large tank of soil at ten different locations, both instruments side by side at each location, and obtained the following results. Suction (in cm) Tensiometer
Measured by Electrical Resistivity Probe
355 365 305 300 360 375 330 360 345 340 315 320 375 385 350 380 330 330 350 390 Choose an appropriate level of significance and test for a significant difference in the variance of the two instruments. 6. A general contractor is considering purchasing lumber from one of two different suppliers. A sample of 12 boards is obtained from each supplier and the length of each board is measured. The estimated standard deviations from the samples are s1 = 0.13 inch and s2 = 0.17 inch, respectively. Assume the lengths follow a normal distribution. Does this data indicate the lengths of one supplier’s boards are subject to less variability than those from the other supplier? Test using a level of significance equal to 0.02. 7. Wire of a certain type is supplied to an electrical retailer by each of two manufacturers, A and B. Users of the wire suggest that there is more variability (from specimen to specimen) in the resistance of the wire supplied by Company A than in that supplied by Company B. Random samples of wire from spools of the wire supplied by the two companies were taken. The resistances were measured with the following results: Company A B Number of Samples 13 21 Sum of Resistances 96.8 201.4 Sum of Squares of Resistances 732.30 1936.90 Assume the resistances were normally distributed. Use the results of these samples to determine at the 5% level of significance whether or not there is evidence to support the suggestion of the users. CHI SQUARE DISTRIBUTION 1. Three different shops are used to repair electric motors. One hundred motors were sent for sent for each shop. When a motor is returned, it is put in use and then the repair is classified as complete, requiring an adjustment or an incomplete repair. The column totals are fixed 100 each and the grand total is 300. Shop I produced 78 complete repairs, 15 minor adjustments, and 7 incomplete repairs. Shop II produced 56, 30, and 14 respectively; while Shop III produced 54,31, 15 complete, minor adjustment, and incomplete repairs respectively. Is here any significant difference between repairs and Shops at 5% l.o.s.
2.
The following table gives the two wheeler accidents occurred during one week. Days: Sun Mon Tue Wed Thu Fri Sat Accidents: 14 16 8 12 11 9 14 Can you say that the accidents are uniformly distributed over the week? Use 5% LOS.
3. The following table shows the opinions of voters before and after a Prime Minister election. Before After Total For Ruling Party 79 91 170 For Opposition Party 84 66 150 Undecided 37 43 80 Total 200 200 400 Test at 5% LOS whether there has been any change of opinion of voters. 4. To determine whether there really is a relationship between an employee’s performance in the company’s training program and their ultimate success in the job, the company takes a sample of 400 cases from its extensive files and obtain the following results. Performance Success in job (Employer’s raring)
Below Average
Average
Above Average
Poor
23
60
29
Average
28
79
60
Very Good
9
49
63
Use 1% l.o.s to test the hypothesis that is there any relation between performance in the training and the success in the jobs. 5. Absenteeism of Fourth Semester students from Mathematics IV classes is a major concern to math instructors because missing class appears to increase. Three statistics instructors wondered whether the absentee rate was the same for every day of the school week. They took a sample of absent students from three of their statistics classes during one week of the term. The results of the survey appear in the table. Day Mon day Tuesday Wednesday Thursday Friday 22 18 20 32 No. of Students 28 Absent Determine the null and alternate hypotheses needed to run a goodness-of-fit test. 6. Car manufacturers are interested in whether there is a relationship between the size of car an individual drives and the number of people in the driver’s family (that is, whether car size and family size are independent). To test this, suppose that 800 car owners were randomly surveyed with the following results. Conduct a test for independence.
Related Documents
Test Of Hyp Formula & Probs.docx
May 2020 4
Hyp Presentation
April 2020 3
Hyp 2,3,4
May 2020 1
Hyp.0b013e318293645f
October 2019 7
Sm-hyp
November 2019 23
Formula
May 2020 45More Documents from ""
Test Of Hyp Formula & Probs.docx
May 2020 4

Hp General Knowledge.pdf
November 2019 6