Tems Appendices
This document was uploaded by user and they confirmed that they have the permission to share it. If you are author or own the copyright of this book, please report to us by using this DMCA report form. Report DMCA
Overview
Download & View Tems Appendices as PDF for free.
More details
- Words: 18,388
- Pages: 73
Restoration of Intercity Passenger Rail Service in the Minneapolis-Duluth/Superior Corridor
APPENDICES
TEMS, Inc. / SRF Consulting Group, Inc.
December 2007
A
Restoration of Intercity Passenger Rail Service in the Minneapolis-Duluth/Superior Corridor
Appendix A COMPASS™ Model Calibration The COMPASS™ Model System is a flexible multimodal demand-forecasting tool that provides comparative evaluations of alternative socioeconomic and network scenarios. It also allows input variables to be modified to test the sensitivity of demand to various parameters such as elasticities, values of time, and values of frequency. This section describes in detail the model methodology and process using in the Duluth-Minneapolis Corridor Study.
A.1
Description of the COMPASS™ System
The COMPASS™ model is structured on three principal models: Total Demand Model, Hierarchical Modal Split Model, and Induced Demand Model. For this study, these three models were calibrated separately for two trip purposes, i.e., Business and Other (commuter, personal, and social). Moreover, since the behavior of short-distance trip making is significantly different from long-distance trip making, the database was segmented by distance, and independent models were calibrated for both long and short-distance trips. For each market segment, the models were calibrated on origin-destination trip data, network characteristics and base year socioeconomic data. The models are calibrated on the base year data. In applying the models for forecasting, an incremental approach known as the “pivot point” method is used. By applying model growth rates to the base data observations, the “pivot point” method is able to preserve the unique travel flows present in the base data that are not captured by the model variables. Details on how this method is implemented are described below.
A.1.1 Total Demand Model The Total Demand Model, shown in Equation 1, provides a mechanism for assessing overall growth in the travel market. Equation 1: Tijp = eβ0p(SEijp)β1peβ2p Uijp Where, Tijp SEijp Uijp β0p , β1p , β2p
= = = =
Number of trips between zones i and j for trip purpose p Socioeconomic variables for zones i and j for trip purpose p Total utility of the transportation system for zones i to j for trip purpose p Coefficients for trip purpose p
TEMS, Inc. / SRF Consulting Group, Inc.
December 2007
A-1
Restoration of Intercity Passenger Rail Service in the Minneapolis-Duluth/Superior Corridor
As shown in Equation 1, the total number of trips between any two zones for all modes of travel, segmented by trip purpose, is a function of the socioeconomic characteristics of the zones and the total utility of the transportation system that exists between the two zones. For this study, trip purposes include Business and Other, and socioeconomic characteristics consist of population, employment and per capita income. The utility function provides a logical and intuitively sound method of assigning a value to the travel opportunities provided by the overall transportation system. In the Total Demand Model, the utility function provides a measure of the quality of the transportation system in terms of the times, costs, reliability and level of service provided by all modes for a given trip purpose. The Total Demand Model equation may be interpreted as meaning that travel between zones will increase as socioeconomic factors such as population and income rise or as the utility (or quality) of the transportation system is improved by providing new facilities and services that reduce travel times and costs. The Total Demand Model can therefore be used to evaluate the effect of changes in both socioeconomic and travel characteristics on the total demand for travel.
Socioeconomic Variables The socioeconomic variables in the Total Demand Model show the impact of economic growth on travel demand. The COMPASS™ Model System, in line with most intercity modeling systems, uses three variables (population, employment and per capita income) to represent the socioeconomic characteristics of a zone. Different combinations were tested in the calibration process and it was found, as is typically found elsewhere, that the most reasonable and stable relationships consists of the following formulations:
Trip Purpose Business Other
Socioeconomic Variable E i E j ( I i + Ij ) / 2 P i P j ( I i + Ij ) / 2
The business formulation consists of a product of employment in the origin zone, employment in the destination zone, and the average per capita income of the two zones. Since business trips are usually made between places of work, the presence of employment in the formulation is reasonable. The Other formulation consists of a product of population in the origin zone, population in the destination zone and the average per capita income of the two zones. Other trips encompass many types of trips, but the majority is home-based and thus, greater volumes of trips are expected from zones from higher population.
Travel Utility Estimates of travel utility for a transportation network are generated as a function of generalized cost (GC), as shown in Equation 2: Equation 2: Uijp = f(GCijp) Where, GCijp
=
Generalized Cost of travel between zones i and j for trip purpose p
Because the generalized cost variable is used to estimate the impact of improvements in the transportation system on the overall level of trip making, it needs to incorporate all the key modal attributes that affect an individual’s decision to make trips. For the public modes (i.e., rail, bus and air), the generalized cost of travel includes all aspects of travel time (access, egress, in-vehicle times), travel
TEMS, Inc. / SRF Consulting Group, Inc.
December 2007
A-2
Restoration of Intercity Passenger Rail Service in the Minneapolis-Duluth/Superior Corridor
cost (fares, tolls, parking charges), schedule convenience (frequency of service, convenience of arrival/departure times) and reliability. The generalized cost of travel is typically defined in travel time (i.e., minutes) rather than dollars. Costs are converted to time by applying appropriate conversion factors, as shown in Equation 3. The generalized cost (GC) of travel between zones i and j for mode m and trip purpose p is calculated as follows: Equation 3:
GC ijmp = TT ijm +
VOR m p exp( −OTPi jm ) TC ijmp VOF mp OH + + VOT m p VOT mp VOT mp F ijm Ci jm
Where, TTijm
=
TCijmp = VOTmp VOFmp VORmp Fijm Cijm OTPijm OH
= = = = = = =
Travel Time between zones i and j for mode m (in-vehicle time + station wait time + connection wait time + access/egress time + interchange penalty), with waiting, connect and access/egress time multiplied by a factor (greater than 1) to account for the additional disutility felt by travelers for these activities Travel Cost between zones i and j for mode m and trip purpose p (fare + access/egress cost for public modes, operating costs for auto) Value of Time for mode m and trip purpose p Value of Frequency for mode m and trip purpose p Value of Reliability for mode m and trip purpose p Frequency in departures per week between zones i and j for mode m Convenience factor of schedule times for travel between zones i and j for mode m On-time performance for travel between zones i and j for mode m Operating hours per week
Station wait time is the time spent at the station before departure and after arrival. Air travel generally has higher wait times because of security procedures at the airport, baggage checking, and the difficulties of loading a plane. Air trips were assigned wait times of 45 minutes while rail trips were assigned wait times of 30 minutes and bus trips were assigned wait times of 20 minutes. On trips with connections, there would be additional wait times incurred at the connecting station. Wait times are weighted higher than in-vehicle time in the generalized cost formula to reflect their higher disutility as found from previous studies. Wait times are weighted 70 percent higher than in-vehicle time for Business trips and 90 percent higher for Other trips. Similarly, access/egress time has a higher disutility than in-vehicle time. Access time tends to be more stressful for the traveler than in-vehicle time because of the uncertainty created by trying to catch the flight or train. Based on previous work, access time is weighted 30 percent higher than in-vehicle time for air travel and 80 percent higher for rail and bus travel. TEMS has found from past studies that the physical act of transferring trains (or buses or planes) has a negative impact beyond the times involved. To account for this disutility, interchanges are penalized time equivalents. For both air and rail travel, each interchange for a trip results in 40 minutes being added to the Business generalized cost and 30 minutes being added to the Other generalized cost. For bus travel, the interchange penalties are 20 minutes and 15 minutes for Business and Other, respectively.
TEMS, Inc. / SRF Consulting Group, Inc.
December 2007
A-3
Restoration of Intercity Passenger Rail Service in the Minneapolis-Duluth/Superior Corridor
The third term in the generalized cost function converts the frequency attribute into time units. Operating hours divided by frequency is a measure of the headway or time between departures. Tradeoffs are made in the stated preference surveys resulting in the value of frequencies on this measure. Although there may appear to some double counting because the station wait time in the first term of the generalized cost function is included in this headway measure, it is not the headway time itself that is being added to the generalized cost. The third term represents the impact of perceived frequency valuations on generalized cost. TEMS has found it very convenient to measure this impact as a function of the headway. The fourth term of the generalized cost function is a measure of the value placed on reliability of the mode. Reliability statistics in the form of on-time performance (i.e., the fraction of trips considered to be on time) were obtained for the rail and air modes only. The negative exponential form of the reliability term implies that improvements from low levels of reliability have slightly higher impacts than similar improvements from higher levels of reliability.
Calibration of the Total Demand Model In order to calibrate the Total Demand Model, the coefficients are estimated using linear regression techniques. Equation 1, the equation for the Total Demand Model, is transformed by taking the natural logarithm of both sides, as shown in Equation 4: Equation 4:
log(Tijp ) = β 0 p + β1 p log(SEijp ) + β 2 p (U ijp ) Equation 4 provides the linear specification of the model necessary for regression analysis. The segmentation of the database by trip purpose and trip length resulted in four sets of models. Trips that would cover more than 170 miles are considered long-distance trips. This cutoff was chosen because travel behavior switches significantly around this level, with travelers considering faster modes such as air and high-speed rail over the automobile. It should be noted that most of trips in our study area fall into the short distance range since the distance between Minneapolis and Duluth is only about 150 miles. The results of the calibration for the Total Demand Models are displayed in Exhibit 1.
TEMS, Inc. / SRF Consulting Group, Inc.
December 2007
A-4
Restoration of Intercity Passenger Rail Service in the Minneapolis-Duluth/Superior Corridor
Exhibit 1: Total Demand Model Coefficients (1) Long-Distance Trips (trip length greater than 170 miles) Business
log(Tij)
0.7497 log(SEij)+ 0.5792 Uij R2=0.83 (84) (86) where Uij = log[exp(-1.5063 + 1.3027UPub ) + exp(-0.00639 GCCar)]
Other
log(Tij)
0.7891 log(SEij)+ 0.5153 Uij R2=0.86 (107) (89) where Uij = log[exp(1.5747 + 1.4391 UPub) + exp(-0.00868GCCar)]
=
=
- 13.5969 +
- 15.5681 +
Short-Distance Trips (trip length less than 170 miles) Business
log(Tij)
0.5237 log(SEij)+ 1.0150 Uij R2=0.88 (26) (12) where Uij = log[exp(0.579 + 1.5256 UPub) + exp(-0.00484GCCar)]
Other
log(Tij)
0.5629 log(SEij)+ 1.2250 Uij R2=0.89 (24) (14) where Uij = log[exp(5.00191 + 1.6288 UPub) + exp(-0.00599GCCar)]
(1)
=
=
-5.6965
- 7.3650
+
+
t-statistics are given in parentheses.
In evaluating the validity of a statistical calibration, there are two key statistical measures: t-statistics and R2. The t-statistics are a measure of the significance of the model’s coefficients; values of 1.95 and above are considered “good” and imply that the variable has significant explanatory power in estimating the level of trips. The R2 is a statistical measure of the “goodness of fit” of the model to the data; any data point that deviates from the model will reduce this measure. It has a range from 0 to a perfect 1, with 0.4 and above considered “good” for large data sets. Based on these two measures, the total demand calibrations are good. The t-statistics are very high, aided by the large size of the Duluth-Minneapolis data set. There are roughly ten times as many long-distance observations as short-distance observations, resulting in higher t-statistics for the long- distance models. The R2 values imply very good fits of the equations to the data. As shown in Exhibit 1, the socioeconomic elasticity values for the Total Demand Model are close to 0.55 for short distance trips and 0.75 for long distance trips, meaning that each one percent growth in the socioeconomic term generates approximately a 0.55 percent growth in short distance trips and a 0.75 percent growth in long distance trips. Since each component of the socioeconomic term will have this elasticity, a one percent increase in population (or employment) of every zone combined with a one percent increase in income will result in a 1.7 percent growth in short distance trips and a 2.1 percent growth in long distance trips. The coefficient on the utility term is not exactly elastic, but it can be used as an approximation. Thus, the transportation system or network utility elasticity is higher for short-distance trips than long-distance trips, with each one percent improvement in network utility or quality as measured by generalized cost (i.e., travel times or costs) generating approximately a 0.5 percent increase for long-distance trips and a 1.2 percent increase for short trips. The higher elasticity on short trips is partly a result of the scale of the
TEMS, Inc. / SRF Consulting Group, Inc.
December 2007
A-5
Restoration of Intercity Passenger Rail Service in the Minneapolis-Duluth/Superior Corridor
generalized costs. For short trips, a 30-minute improvement would be more meaningful than the same time improvement on long-distance trips, reflecting in the higher elasticity on the short-distance model.
Incremental Form of the Total Demand Model The calibrated Total Demand Models could be used to estimate the total travel market for any zone pair using the population, employment, per capita income, and the total utility of all the modes. However, there would be significant differences between estimated and observed levels of trip making for many zone pairs despite the good fit of the models to the data. To preserve the unique travel patterns contained in the base data, the incremental approach or “pivot point” method is used for forecasting. In the incremental approach, the base travel data assembled in the database are used as pivot points, and forecasts are made by applying trends to the base data. The total demand equation as described in Equation 1 can be rewritten into the following incremental form that can be used for forecasting (Equation 5): Equation 5:
Tijp
f
Tijp
b
SEijp f = SE b ijp
β1 p
exp( β 2 p ( U ijp
f
b
− U ijp ) )
Where, Tfijp Tfijp SEfijp SEbijp Ufijp
= = = = =
Ubijp
=
Number of Trips between zones i and j for trip purpose p in forecast year f Number of Trips between zones i and j for trip purpose p in base year b Socioeconomic variables for zones i and j for trip purpose p in forecast year f Socioeconomic variables for zones i and j for trip purpose p in base year b Total utility of the transportation system for zones i to j for trip purpose p in forecast year f Total utility of the transportation system for zones i to j for trip purpose p in base year b
In the incremental form, the constant term disappears and only the elasticities are important.
Hierarchical Modal Split Model The role of the Hierarchical Modal Split Model is to estimate relative modal shares, given the Total Demand Model estimate of the total market. The relative modal shares are derived by comparing the relative levels of service offered by each of the travel modes. The COMPASS™ Hierarchical Modal Split Model uses a nested logit structure, which has been adapted to model the intercity modal choices available in the study area. As shown in Exhibit 2, three levels of binary choice are calibrated.
TEMS, Inc. / SRF Consulting Group, Inc.
December 2007
A-6
Restoration of Intercity Passenger Rail Service in the Minneapolis-Duluth/Superior Corridor
Exhibit 2: Hierarchical Structure of the Modal Split Model
The main feature of the Hierarchical Modal Split Model structure is the increasing commonality of travel characteristics as the structure descends. The first level of the hierarchy separates private auto travel – with its spontaneous frequency, low access/egress times, low costs and highly personalized characteristics – from the public modes. The second level of the structure separates air – the fastest, most expensive and perhaps most frequent and comfortable public mode – from the rail and bus surface modes. The lowest level of the hierarchy separates rail, a potentially faster, more reliable, and more comfortable mode, from the bus mode.
Form of the Hierarchical Modal Split Model To assess modal split behavior, the logsum utility function, which is derived from travel utility theory, has been adopted. As the modal split hierarchy ascends, the logsum utility values are derived by combining the generalized costs of travel. Advantages of the logsum utility approach are 1) the introduction of a new mode will increase the overall utility of travel, and 2) a new mode can readily be incorporated into the Hierarchical Modal Split Model, even if it were not included in the base-year calibration. As only two choices exist at each level of the modal split hierarchical structure, a Binary Logit Model is used, as shown in Equation 6: Equation 6:
Pijmp =
exp(U ijmp / ρ ) exp(U ijmp / ρ ) + exp(U ijnp / ρ )
Where, Pijmp Uijmp, Uijnp
= =
Percentage of trips between zones i and j by mode m for trip purpose p Utility functions of modes m and n between zones i and j for trip purpose i ρ is called the nesting coefficient
TEMS, Inc. / SRF Consulting Group, Inc.
December 2007
A-7
Restoration of Intercity Passenger Rail Service in the Minneapolis-Duluth/Superior Corridor
In Equation 6, the utility of travel between zones i and j by mode m for trip purpose p is a function of the generalized cost of travel. Where mode m is a composite mode (e.g., the surface modes in the third level of the Modal Split Model hierarchy, which consist of the rail and bus modes), the utility of travel, as described below, is derived from the utility of the two or more modes it represents.
Utility of Composite Modes Where modes are combined, as in the upper levels of the modal split hierarchy, it is essential to be able to measure the “inclusive value” of the composite mode, e.g., how the combined utility for bus and rail compares with the utility for bus or rail alone. The combined utility is more than the utility of either of the modes alone, but it is not simply equal to the sum of the utilities of the two modes. A realistic approach to solving this problem, which is consistent with utility theory and the logit model, is to use the logsum function. As the name logsum suggests, the utility of a composite mode is defined as the natural logarithm of the sum of the utilities of the component modes. In combining the utility of separate modes, the logsum function provides a reasonable proportional increase in utility that is less than the combined utilities of the two modes, but reflects the value of having two or more modes available to the traveler. For example: Suppose Utility of Rail or Urail = α + β0GCrail Utility of Bus or Ubus = β1GCbus Then Inclusive Utility of Surface Modes, or Usurface = log(eUrail + eUbus) Improvements in either rail or bus would result in improvements to the inclusive utility of the surface modes. In a nested binary logit model, the calibrated coefficients associated with the inclusive values of composite modes are the nesting coefficients and take on special meaning. If one of these coefficients is equal to 1, then that level of the hierarchical model collapses and two levels of the hierarchy essentially become 1. At this point, the Hierarchical Modal Split Model is a multinomial logit model that is analyzing three or more modes, i.e., all the modes comprising the composite mode as well as the other modes in that level of the hierarchy.
Calibration of the Hierarchical Modal Split Model Working from the bottom of the hierarchy up to the top, the first analysis is that of the rail mode versus the bus mode. As shown in Exhibit 3, the model was effectively calibrated for the two trip purposes and the two trip lengths, with reasonable parameters and R2 and t values. All the coefficients have the correct signs such that demand increases or decreases in the correct direction as travel times or costs are increased or decreased, and all the coefficients appear to be reasonable in terms of the size of their impact.
TEMS, Inc. / SRF Consulting Group, Inc.
December 2007
A-8
Restoration of Intercity Passenger Rail Service in the Minneapolis-Duluth/Superior Corridor
Exhibit 3: Rail versus Bus Modal Split Model Coefficients (1) Long-Distance Trips (trip length greater than 170 miles) Business log(PRail/PBus) = 2.5592 - 0.00421 GCRail (48)
+
0.003013 GCBus (58)
R2=0.65
Other
+
0.00467 GCBus (76)
R2=0.76
Short-Distance Trips (trip length less than 170 miles) Business log(PRail/PBus) = 2.2747 - 0.00314 GCRail (15)
+
0.00575 GCBus (29)
R2=0.83
Other
+
0.00895 GCBus (38)
R2=0.88
(1)
log(PRail/PBus)
log(PRail/PBus)
= 1.3874
= 1.667
- 0.00491 GCRail (45)
- 0.00509 GCRail (18)
t-statistics are given in parentheses.
The constant term in each equation indicates the degree of bias towards one mode or the other. Since the terms are positive in all the market segments, there is a bias towards rail travel that is not explained by the variables (e.g., times, costs, frequencies, reliability) used to model the modes. As expected, this bias is larger for business travelers who tend to have very negative perceptions of intercity bus. For the second level of the hierarchy, the analysis is of the surface modes (i.e., rail and bus) versus air. Accordingly, the utility of the surface modes is obtained by deriving the logsum of the utilities of rail and bus. As shown in Exhibit 4, the model calibrations for both trip purposes are all statistically significant, with good R2 and t values and reasonable parameters. As indicated by the constant terms, there is a large bias towards air travel for long-distance trips. However, for short trips, there is only a small bias towards air for both Business and Other travelers. This difference is understandable since travelers for long distance trips prefer air travel more than travelers for short distance trips.
TEMS, Inc. / SRF Consulting Group, Inc.
December 2007
A-9
Restoration of Intercity Passenger Rail Service in the Minneapolis-Duluth/Superior Corridor
Exhibit 4: Surface versus Air Modal Split Model Coefficients (1) Long-Distance Trips (trip length greater than 170 miles) Business
Other
log(PSurf/PAir)
=
where USurf
=
log(PSurf/PAir)
=
where USurf
=
1.1755USurf + 0.0055 GCAir R2=0.87 (106) (56) log[exp(2.5592 -0.00421 GCRail) + exp(-0.00301 GCBus)] -3.0135 +
0.9062 USurf + 0.00640 GCAir R2=0.56 (96) (58) log[exp(1.387 -0.00491 GCRail ) + exp(-0.00467 GCBus)] -3.36
+
Short-Distance Trips (trip length less than 170 miles) Business
Other
(1)
log(PSurf/PAir)
=
where USurf
=
log(PSurf/PAir)
=
where USurf
=
-1.1985 + 1.1103 USurf + 0.00683 GCAir R2=0.84 (20) (24) log[exp(2.2747 -0.00314 GCRail) + exp(-0.00575 GCBus)] -0.4791 + 0.9967 USurf + 0.00833 GCAir R2=0.88 (23) (32) log[exp(1.667 -0.00509 GCRail) + exp(-0.00895 GCBus)]
t-statistics are given in parentheses.
The analysis for the top level of the hierarchy is of auto versus the public modes. The utility of the public modes is obtained by deriving the logsum of the utilities of the air, rail and bus modes. As shown in Exhibit 5, the model calibrations for both trip purposes are all statistically significant, with good R2 and t values and reasonable parameters in most cases. A reason for why the R2 value for the short-distance model is a bit lower than in the rest of the model is due to the fact that local transit trips are not included in the public trip database, causing some of the observations to deviate significantly from the model equation.
TEMS, Inc. / SRF Consulting Group, Inc.
December 2007
A-10
Restoration of Intercity Passenger Rail Service in the Minneapolis-Duluth/Superior Corridor
Exhibit 5: Public versus Auto Hierarchical Modal Split Model Coefficients (1)
Long-Distance Trips (trip length greater than 170 miles) Business log(PPub/PAuto) = -1.506 + 1.3027 UPub + 0.00639 GCAuto R2=0.94 (71) (173) where UPub = log[exp(-3.0135+1.1755 USurf ) + exp(-0.0055 GCAir)] Other
(PPub/PAuto)
=
where UPub
=
1.5747 + 1.439 UPub + 0.00868 GCAuto R2=0.96 (132) (214) log[exp(-3.3577 +0.9062 USurf ) + exp(-0.0064 GCAir)]
Short-Distance Trips (trip length less than 170 miles) Business log(PPub/PAuto) = 0.579 + 1.526 UPub + 0.00484 GCAuto R2=0.68 (19) (7) where UPub = log[exp(-1.1986 + 1.1103 USurf) + exp(-0.0068 GCAir)] Other
(1)
log(PPub/PAuto)
=
where UPub
=
5.0019 + 1.6288 UPub + 0.005991 GCAuto R2=0.69 (21) (4) log[exp(-0.4791 + 0.9967 USurf ) + exp(-0.0083 GCAir)]
t-statistics are given in parentheses.
Incremental Form of the Modal Split Model Using the same reasoning as previously described, the modal split models are applied incrementally to the base data rather than imposing the model estimated modal shares. Different regions of the corridor may have certain biases toward one form of travel over another and these differences cannot be captured with a single model for the entire system. Using the “pivot point” method, many of these differences can be retained. To apply the modal split models incrementally, the following reformulation of the hierarchical modal split models is used (Equation 7):
Equation 7:
P Af ) P Bf = e P Ab ( ) P Bb
(
β ( GC
f A
− GC
b B
) + γ ( GC
f B
− GC
b B
)
For hierarchical modal split models that involve composite utilities instead of generalized costs, the composite utilities would be used in the above formula in place of generalized costs. Once again, the constant term is not used and the drivers for modal shifts are changed in generalized cost from base conditions. Another consequence of the pivot point method is that extreme changes from current trip-making levels and current modal shares are rare. Thus, since very few short-distance commuter trips are currently being made on Amtrak, the forecasted growth in these trips will be limited despite the huge auto market.
TEMS, Inc. / SRF Consulting Group, Inc.
December 2007
A-11
Restoration of Intercity Passenger Rail Service in the Minneapolis-Duluth/Superior Corridor
Induced Demand Model Induced demand refers to changes in travel demand related to improvements in a transportation system, as opposed to changes in socioeconomic factors that contribute to growth in demand. The quality or utility of the transportation system is measured in terms of total travel time, travel cost, and worth of travel by all modes for a given trip purpose. The induced demand model used the increased utility resulting from system changes to estimate the amount of new (latent) demand that will result from the implementation of the new system adjustments. The model works simultaneously with the mode split model coefficients to determine the magnitude of the modal induced demand based on the total utility changes in the system.
TEMS, Inc. / SRF Consulting Group, Inc.
December 2007
A-12
Restoration of Intercity Passenger Rail Service in the Minneapolis-Duluth/Superior Corridor
Appendix B Networks Air network
TEMS, Inc. / SRF Consulting Group, Inc.
December 2007
B-1
Restoration of Intercity Passenger Rail Service in the Minneapolis-Duluth/Superior Corridor
Bus network
TEMS, Inc. / SRF Consulting Group, Inc.
December 2007
B-2
Restoration of Intercity Passenger Rail Service in the Minneapolis-Duluth/Superior Corridor
Auto network
TEMS, Inc. / SRF Consulting Group, Inc.
December 2007
B-3
Restoration of Intercity Passenger Rail Service in the Minneapolis-Duluth/Superior Corridor
Rail network
TEMS, Inc. / SRF Consulting Group, Inc.
December 2007
B-4
Restoration of Intercity Passenger Rail Service in the Minneapolis-Duluth/Superior Corridor
Appendix C Engineering Cost Estimates
TEMS, Inc. / SRF Consulting Group, Inc.
December 2007
C-1
Restoration of Intercity Passenger Rail Service in the Minneapolis-Duluth/Superior Corridor
Option 79/1 ITEM DESCRIPTION BNSF Resurface, Tie Replacement, FRA Cl. 4 Grade Crossing signal adjustments, Hinckley sub
NOTES
UNIT mile lot
UNIT PRICE
EST. QTY.
150,000
148
22,200,000
1,200,000
1
1,200,000
Switch improvements – Hinckley subdivision: 1
Powered # 24 switches, mainline sidings
2
Control and signal connection
EST. AMOUNT
0 each lot
85,000
14
1,190,000
1,200,000
1
1,200,000
Station Sites (Four)
0
1
Paved Platform
each
13,500
4
54,000
2
ADA Ramps
each
16,000
4
64,000
mile
50,000
30
1,500,000
Fencing, Residential & Safety related Duluth-Superior Passenger Mainline Bypasses
0
1
New Track, incl. fill & roadbed
mile
1,500,000
2
Powered # 20 Switches
each
80,000
21
1,680,000
3
Grade Crossing surfacing
lin. Ft.
375
700
262,500
4
Diamond
each
420,000
1
420,000
5
Earthwork, Drainage, Utilities
5,775,000
1
5,775,000
6
Property Acquisition (SOO)
100,000
20
2,000,000
7
Engineering, property, & coordination
lot
1,100,000
1
1,100,000
8
Signals, controls and connections
lot
3,550,000
1
lot acres
8.9
SUBTOTAL Mobilization (excl. BNSF) Contingencies
3,550,000 55,545,500
5%
-
-
1,121,689
10%
-
-
2,757,628
TOTAL – OPTION 79/1:
TEMS, Inc. / SRF Consulting Group, Inc.
13,350,000
59,424,817
December 2007
C-2
Restoration of Intercity Passenger Rail Service in the Minneapolis-Duluth/Superior Corridor
TEMS, Inc. / SRF Consulting Group, Inc.
December 2007
C-3
Restoration of Intercity Passenger Rail Service in the Minneapolis-Duluth/Superior Corridor
Option 79/4 ITEM DESCRIPTION
NOTES
BNSF Resurface, Tie Replacement, FRA Cl. 4
mile
UNIT PRICE 150,000
EST. QTY. 148
EST. AMOUNT 22,200,000
UNIT
Install High Speed powered Switches & locks 1
Powered # 24 Switches
each
85,000
22
1,870,000
2
Powered #20 Switches
each
80,000
1
80,000
3
Electric locked #11 switches
each
30,000
13
390,000
4
Control & Signal Connections
lot
2,500,000
1
2,500,000
mile
1,500,000
1.3
1,950,000
mile
1,500,000
2
3,000,000
mile
1,500,000
2
3,000,000
mile
1,500,000
3
4,500,000
mile
1,500,000
2.7
4,050,000
Foxboro Siding Extension: MP 24.7-25.1, 23.3-22.2 1
New railroad tracks
Bruno Siding Extension; MP 49.5-51.5 1
New railroad tracks
Cambridge Siding Extension; MP 106.0-108.0 1
New railroad tracks
Isanti Siding Extension; MP 113.3-116.3 1
New railroad track
Andover Siding Extension; MP 127.0=129.7 1
New railroad tracks
Subtotal, Hinckley Sub Speed/Capacity Upgrade Northtown Yard Third Main 1
BNSF Project 19, total
TEMS, Inc. / SRF Consulting Group, Inc.
43,540,000 1 lot
34,800,000
December 2007
1
34,800,000
C-4
Restoration of Intercity Passenger Rail Service in the Minneapolis-Duluth/Superior Corridor
ITEM DESCRIPTION
NOTES
Minneapolis Junction Double Track
1
UNIT
UNIT PRICE
1
double track west leg of wye (track 0702)
mile
1,500,000
2
Powered # 24 switches
each
3
crossover
4
diamond
5
Signal protection and interlocks
Minneapolis Stub Terminal, Fifth Street
EST. QTY.
EST. AMOUNT
0.5
750,000
85,000
3
255,000
each
210,000
1
210,000
each
420,000
1
420,000
lot
500,000
1
500,000
0.6
900,000
1
1
New railroad track (two spurs)
mile
1,500,000
2
Powered # 20 Switches
each
85,000
2
170,000
3
Crossover
each
210,000
1
210,000
4
Platforms & Canopies
lot
350,000
1
350,000
Subtotal, Minneapolis Capacity Improvements Duluth-Superior Passenger Mainline Bypasses
38,565,000 2
1
New Track, incl. fill & roadbed
mile
1,500,000
2
Powered # 20 Switches
each
80,000
21
1,680,000
3
Grade Crossing surfacing
lin. Ft.
375
700
262,500
4
Diamond
each
5
Earthwork, Drainage, Utilities
6
Property Acquisition (SOO)
7
Engineering, property, & coordination
8 Signals, controls and connections Subtotal – Twin Ports Speed/Capacity Upgrades
TEMS, Inc. / SRF Consulting Group, Inc.
8.9
13,350,000
420,000
1
420,000
5,775,000
1
5,775.50
100,000
20
200,000
lot
1,100,000
1
1,100,000
lot
3,550,000
1
3,550,000 20,568,276
lot acres
December 2007
C-5
Restoration of Intercity Passenger Rail Service in the Minneapolis-Duluth/Superior Corridor
ITEM DESCRIPTION
NOTES
CTC Signaling & Grade Crossing, Hinckley Sub
3
UNIT
UNIT PRICE
EST. QTY.
EST. AMOUNT
1
Control Point
each
541,000
23
12,443,000
2
Intermediate signal (dual track0
each
272,000
23
6,256,000
3
Intermediate signal (single track)
each
208,000
24
4,992,000
4
Detectors (hot box, dragging, high/wide)
each
118,000
7
826,000
5
Electric Switch Lock
each
73,000
34
2,482,000
6
ATCS base station
each
394,000
5
1,970,000
9
Grade Crossings (gates, flashers, control)
each
205,000
91
18,655,000
Subtotal – Signal System Installations
47,624,000
Additional Infrastructure: ITEM DESCRIPTION Station Sites (four)
NOTES
UNIT
UNIT PRICE 13,500
Paved Platform
each
2
ADA Ramps
each mile
50,000
Subtotal, Infrastructure components Mobilization (Excl. BNSF) Contingencies
4
54,000
4
64,000
30
1,500,000 1,618,000
5%
3,008,025
10%
15,191,528
Total – OPTION 79/4
TEMS, Inc. / SRF Consulting Group, Inc.
EST. AMOUNT
4
1
Fencing, Residential & Safety related
EST. QTY.
170,114,828
December 2007
C-6
Restoration of Intercity Passenger Rail Service in the Minneapolis-Duluth/Superior Corridor
TEMS, Inc. / SRF Consulting Group, Inc.
December 2007
C-7
Restoration of Intercity Passenger Rail Service in the Minneapolis-Duluth/Superior Corridor
Option 110 BNSF Resurface, Tie Replacement, FRA Cl.
mile
UNIT PRIC 265,000
Install High Speed powered Switches & lock 1 Powered # 24 Switches 2 Powered #20 Switches 3 Electric locked #11 switches 4 Control & Signal Connections
each each each lot
85,000 80,000 30,000 2,500,000
22 1 13 1
1,870,000 80,000 390,000 2,500,000
Foxboro Siding Extension MP 24.7-25.1, 23.3-22.2 1 New railroad tracks
mile
1,500,000
1.3
1,950,000
Nickerson double tracking, MP 30.3-40.3 1 New railroad tracks
mile
1,500,000
8.6
12,900,000
Bruno Siding Extension; MP 49.5-51.5 1 New railroad tracks
mile
1,500,000
2
3,000,000
Brook Park-Hinckley double tracking; MP 72.4-80.4 1 New railroad tracks
mile
1,500,000
4.9
7,350,000
Braham Siding Addition, MP 97.0-99.0 1 New Railroad tracks
mile
1,500,000
2
3,000,000
Cambridge-Isanti double tracking; MP 106.0-116.3 1 New railroad track
mile
1,500,000
8.1
12,150,000
Andover Siding Extension; MP 127.0=129.7 1 New railroad tracks Subtotal, Hinckley Sub Speed/Capacity Upgrade
mile
1,500,000
2.7
4,050,000 85,280,000
TEMS, Inc. / SRF Consulting Group, Inc.
December 2007
ITEM DESCRIPTION
NOTES
UNIT
EST. QTY 136
EST. AMOUNT 36,040,000
C-8
Restoration of Intercity Passenger Rail Service in the Minneapolis-Duluth/Superior Corridor
ITEM DESCRIPTION
NOTES
Northtown Yard Third Main 1 BNSF Project 19, total
1
Minneapolis Junction Double Track 1 Double track west leg of wye (track 0702) 2 Powered # 24 switches 3 Crossover 4 Diamond 5 Signal protection and interlocks
1
Minneapolis Stub Terminal, Fifth Street 1 New railroad track (two spurs) 2 Powered # 24 Switches 3 Crossover 4 Platforms & Canopies
1
UNIT PRIC
UNIT
lot
EST. QTY
34,800,000
1
34,800,000
mile each each each lot
1,500,000 85,000 210,000 420,000 500,000
0.5 3 1 1 1
750,000 255,000 210,000 420,000 500,000
mile each each lot
1,500,000 85,000 210,000 350,000
0.6 2 1 1
900,000 170,000 210,000 350,000
Subtotal, Minneapolis Capacity Improvements Duluth-Superior Passenger Mainline Bypasses 1 New Track, incl. fill & roadbed 2 Powered # 20 Switches 3 Grade Crossing surfacing 4 Diamond 5 Earthwork, Drainage, Utilities 6 Property Acquisition (SOO) 7 Engineering, property, & coordination 8 Signals, controls and connections Subtotal, Twin Ports Speed/Capacity Upgrades
TEMS, Inc. / SRF Consulting Group, Inc.
EST. AMOUNT
38,565,000 2 mile each lin. Ft. each lot acres lot lot
1,500,000 80,000 375 420,000 5,775,000 100,000 1,100,000 3,550,000
December 2007
8.9 21 700 1 1 20 1 1
13,350,000 1,680,000 262,500 420,000 5,775.50 200,000 1,100,000 3,550,000 20,568,276
C-9
Restoration of Intercity Passenger Rail Service in the Minneapolis-Duluth/Superior Corridor
ITEM DESCRIPTION
NOTES
CTC Signalling & Grade Crossing, Hinckley Sub 1 Control Point 2 Intermediate signal (dual track0 3 Intermediate signal (single track) 4 Detectors (hot box, dragging, high/wide) 5 Electric Switch Lock 6 ATCS base station
3
Positive Train Control (PTC) Overlay 1 Signal system, Comm system, cab interface Grade crossing interface, CTC interlock
UNIT
UNIT PRIC
each each each each each each
541,000 272,000 208,000 118,000 73,000 394,000
lot
30,000,000
EST. QTY 23 23 24 7 34 5
1
Subtotal, Signal System Installations
each each each
3,000,000 550,000 205,000
2 84 26
Subtotal, Crossing Upgrades
Fencing, Residential & Safety related
12,443,000 6,256,000 4,992,000 826,000 2,482,000 1,970,000
30,000,000 58,969,000
Road/Rail Crossing Upgrades - Sealed Corridor 1 Grade separations 2 Quad gating & traffic control 3 Gated grade crossings
Additional Infrastructure: Station Sites (four) 1 Paved Platform 2 ADA Ramps
EST. AMOUNT
6,000,000 46,200,000 5,330,000 57,530,000
4 each each
13,500
4 4
54,000 64,000
mile
50,000
112
5,600,000
Subtotal, Infrastructure components
5,718,000
Mobilization (Excl. BNSF)
5%
5,311,175
Contingencies
10%
26,663,028
Total, OPTION 110
TEMS, Inc. / SRF Consulting Group, Inc.
298,604,478
December 2007
C-10
Restoration of Intercity Passenger Rail Service in the Minneapolis-Duluth/Superior Corridor
Option 125 BNSF Resurface, Tie Replacement, FRA Cl. 7
mile
UNIT PRIC 300,000
Install High Speed powered Switches & locks 1 Powered # 24 Switches 2 Powered #20 Switches 3 Electric locked #11 switches 4 Control & Signal Connections
each each each lot
85,000 80,000 30,000 2,500,000
22 1 13 1
1,870,000 80,000 390,000 2,500,000
Foxboro Siding Extension; MP 24.7-25.1, 23.3-22.2 1 New railroad tracks
mile
1,500,000
1.3
1,950,000
Nickerson double tracking, MP 30.3-40.3 1 New railroad tracks
mile
1,500,000
8.6
12,900,000
Bruno Siding Extension; MP 49.5-51.5 1 New railroad tracks
mile
1,500,000
2
3,000,000
Brook Park-Hinckley double tracking; MP 72.4-80.4 1 New railroad tracks
mile
1,500,000
4.9
7,350,000
Braham Siding Addition, MP 97.0-99.0 1 New Railroad tracks
mile
1,500,000
2
3,000,000
Cambridge-Isanti double tracking; MP 106.0-116.3 1 New railroad track
mile
1,500,000
8.1
12,150,000
mile
1,500,000
2.7
4,050,000 90,040,000
ITEM DESCRIPTION
Andover Siding Extension; MP 127.0=129.7 1 New railroad tracks Subtotal, Hinckley Sub Speed/Capacity Upgrade
TEMS, Inc. / SRF Consulting Group, Inc.
NOTES
UNIT
December 2007
EST. QTY 136
EST. AMOUNT 40,800,000
C-11
Restoration of Intercity Passenger Rail Service in the Minneapolis-Duluth/Superior Corridor
ITEM DESCRIPTION
NOTES
Northtown Yard Third Main 1 BNSF Project 19, total
1
Minneapolis Junction Double Track 1 double track west leg of wye (track 0702) 2 Powered # 24 switches 3 crossover 4 diamond 5 Sinal protection and interlocks
1
Minneapolis Stub Terminal, Fifth Street 1 New railroad track (two spurs) 2 Powered # 24 Switches 3 Crossover 4 Platforms & Canopies
1
UNIT
UNIT PRIC
EST. QTY
lot
34,800,000
1
34,800,000
mile each each each lot
1,500,000 85,000 210,000 420,000 500,000
0.5 3 1 1 1
750,000 255,000 210,000 420,000 500,000
mile each each lot
1,500,000 85,000 210,000 350,000
0.6 2 1 1
900,000 170,000 210,000 350,000
Subtotal, Minneapolis Capacity Improvements Duluth-Superior Passenger Mainline Bypasses 1 New Track, incl. fill & roadbed 2 Powered # 20 Switches 3 Grade Crossing surfacing 4 Diamond 5 Earthwork, Drainage, Utilities 6 Property Acquisition (SOO) 7 Engineering, property, & coordination 8 Signals, controls and connections
38,565,000 2 mile each lin. Ft. each lot acres lot lot
1,500,000 80,000 375 420,000 5,775,000 100,000 1,100,000 3,550,000
Subtotal, Twin Ports Speed/Capacity Upgrades
TEMS, Inc. / SRF Consulting Group, Inc.
EST. AMOUNT
8.9 21 700 1 1 20 1 1
13,350,000 1,680,000 262,500 420,000 5,775,500 200,000 1,100,000 3,550,000 26,338,000
December 2007
C-12
Restoration of Intercity Passenger Rail Service in the Minneapolis-Duluth/Superior Corridor
ITEM DESCRIPTION
NOTES
CTC Signalling & Grade Crossing, Hinckley Sub 1 Control Point 2 Intermediate signal (dual track0 3 Intermediate signal (single track) 4 Detectors (hot box, dragging, high/wide) 5 Electric Switch Lock 6 ATCS base station
3
Positive Train Control (PTC) Overlay 1 Signal system, Comm system, cab interface Grade crossing interface, CTC interlock Subtotal, Signal System Installations
Fencing, Residential & Safety related Subtotal, Infrastructure components Mobilization (Excl. BNSF) Contingencies
UNIT PRIC
each each each each each each
541,000 272,000 208,000 118,000 73,000 394,000
23 23 24 7 34 5
12,443,000 6,256,000 4,992,000 826,000 2,482,000 1,970,000
30,000,000
1
30,000,000
lot
EST. AMOUNT
each each lot
3,000,000 650,000 7,000,000
80 26 1
240,000,000 16,900,000 7,000,000 263,900,000
each each
13,500
4 4
54,000 64,000
mile
50,000
140
7,000,000 7,118,000 15,349,675 45,493,000
4
5% 10%
Total, OPTION 125
TEMS, Inc. / SRF Consulting Group, Inc.
EST. QTY
28,969,000
Road/Rail Crossing Upgrades - Sealed Corridor 1 Grade separations 2 Barrier gating & traffic control 4 Contingency for at-grade closures Subtotal, Crossing Upgrades Additional Infrastructure: Station Sites (four) 1 Paved Platform 2 ADA Ramps
UNIT
545,772,675
December 2007
C-13
Restoration of Intercity Passenger Rail Service in the Minneapolis-Duluth/Superior Corridor
Notes NOTE 1: Northtown third mainline track assumed to be required at more than 1 round trip frequency per day. Minneapolis Junction and Fifth Street stub terminal (2 tracks) required at frequencies of 3 or more daily round trips to prevent schedule and operational conflicts with Northstar Commuter Rail and freights. NOTE 2: Includes double tracking BNSF "Coal Runner" in Superior and yard leads from Berwind Yard to Duluth Union Depot to improve running speeds above 10-25 mph and eliminate conflicts with freight yard switching. Includes Duluth storage and servicing facility for passenger trains. NOTE 3: Includes all signaling and connections to interface grade crossing protection, automatic switches, and electric lockouts of spur tracks into Centralized Traffic Control (CTC) system to replace block signaled, manual warrant dispatch system in current use to allow active control of co-mingled freight and passenger trains at expected speeds and frequencies. NOTE 4: Intermediate stations designated in study include Foley, Cambridge, Hinckley, and Superior. Construction assumes substructure and low-level paved platform at trackside, plus raised island and ramp for ADA accessibility.
TEMS, Inc. / SRF Consulting Group, Inc.
December 2007
C-14
Restoration of Intercity Passenger Rail Service in the Minneapolis-Duluth/Superior Corridor
Additional Estimates Twin Ports Capacity Improvement & Alternate Routing: ITEM DESCRIPTION
NOTES
UNIT
UNIT PRICE
EST. QTY.
EST. AMOUNT
Option 125 Steelton Subdivision: Reserve Main upgrade 1
New railroad track & resurface
mile
1,500,000
3
4,500,000
2
Powered #24 Switches
each
85,000
2
170,000
3
Locked # 20 Switches
each
80,000
9
720,000
4
Grade Crossing protection
each
202,500
16
3,240,000
5
Signaling, Control points & intermediates
1,290,000
1
1,290,000
lot
Subtotal – Reserve Main
9,920,000
Potential Station Accommodations per FRA proposed guidance on platforms: ITEM DESCRIPTION
NOTES
UNIT
UNIT PRICE
EST. QTY.
EST. AMOUNT
Option 125 1
New Track, Stations (min. .25 miles ea.)
mile
1,500,000
1
1,500,000
2
Powered #24 Switches
each
85,000
8
680,000
3
Signal protection
each
205,000
4
820,000
Subtotal, Passenger Station Sidings
TEMS, Inc. / SRF Consulting Group, Inc.
3,000,000
December 2007
C-17
Restoration of Intercity Passenger Rail Service in the Minneapolis-Duluth/Superior Corridor
C.1
Additional Estimates
Steelton Subdivision Improvements The alternate route from Saunders to Duluth in the Twin Ports area consists of utilizing the Canadian National Railway mainline west from Saunders Junction, past CN’s Pokegama Yard and across the St. Louis River on the Oliver Bridge to New Duluth and Steelton Yard. From there, the line parallels the river to the north east, connecting to the BNSF before Grassy Point Draw for the run into Duluth Depot. The line from Saunders to Steelton is a high-grade freight mainline with active signaling. From Steelton on, the line is low frequency freight and yard trackage, which will need to upgraded for track condition and surface, signaling, and grade crossings to allow acceptable speeds. If utilized as a passenger mainline, this route would include West Duluth, Minnesota, but bypass Superior, Wisconsin. It would also obviate the need for some or all of the planned improvement on BNSF’s Coal Runner in Superior. Using the Steelton Subdivision as a reserve mainline and freight reliever, both investments may be appropriate to maximize capacity and flexibility for supporting higher frequency, high speed passenger runs through the Twin Ports.
Station Sidings Two potential requirements were taken into consideration at the four intermediate station sites. The base assumption was for trains to stop on the mainline at a low-level (track-level) platform, with an ADA ramp, tower, or bridge installed to allow access to the train, per current Amtrak intercity practice. However, the FRA is proposing new rulemaking that would require full train ADA access from a passenger floor-height platform, with minimum clearances required between car and platform. Since this may require a mid or high platform level that would restrict wide freight loads, the BNSF would require a passenger siding or gauntlet track at each station to allow a platform setback from the mainline. The second issue is a possible BNSF requirement for a station siding to allow freight and passenger train runby’s while a train is stopped for passenger loading or discharge. Cost estimates were prepared to reflect either of these possible additions to project facilities at the modeled intermediate stations.
Minneapolis Terminal Enhancements Each of the higher frequency passenger train scenarios requires additional train terminal capacity in Minneapolis above and beyond provisions for the Northstar Commuter Rail operations. This would be provided by a stub-end terminal with two tracks and two outside platforms ending at the Fifth Street viaduct. Platforms would connect beyond the ends of the tracks. An engineering proof of concept was performed, with a track layout utilizing No. 20 switches, 885 foot radius curvature, and normal track centers and platform widths superimposed on the current land use, roads, and bridges. The concept was shown to be feasible and expandable under these specifications and conditions. In the main project cost estimates, the project costs were limited to track and platform costs, similar to the treatments assumed at other station sites, with the host city providing land and improved passenger facilities. The additional costs illustrate the estimated land acquisition costs, and vertical circulation improvements to connect the station platforms to street and LRT-platform level. If the additional vertical circulation is not provided, it is assumed that cross-track access to Northstar’s accommodations and/or vehicular access at platform level will satisfy ADA needs. It should be noted that only ground-level access is needed to permit construction of the required station platforms and tracks. Therefore, the land values need not include air rights. However, the value of the land, which has already been purchased by the city, might be counted towards the local matching share for the Federal funding match.
TEMS, Inc. / SRF Consulting Group, Inc.
December 2007
C-18
Restoration of Intercity Passenger Rail Service in the Minneapolis-Duluth/Superior Corridor
Appendix D Preliminary Environmental Scan November 30, 2007 D.1
Project Purpose
SRF Consulting Group, Inc. was charged with completing an initial environmental scan for the Minneapolis-Duluth Passenger Rail Study. The environmental scan gathered information on a limited number of critical resources or elements that are considered key locational factors in preliminary project analyses. The location of any of these resources or elements within a project corridor is cause for project planners to determine whether they can avoid the resource, or otherwise mitigate impacts to the resources. At this early, preliminary stage of project planning, the information is gathered primarily to help inform decision makers as they carry out further studies. The data gathered for this project includes: •
Demographic information for evaluation of environmental justice issues
•
Location of surveyed historic and archaeological properties
•
Identification of wetland areas
•
Location of parks and wildlife refuges
•
Presence of threatened and endangered species
•
General community cohesion (smaller communities only)
Each of these elements will be analyzed in more detail in a future environmental document required for the project. This level of analysis is at a broad, high level, intended to identify only the most critical issues. Each section of this report contains a brief discussion of each topic identifying the methodology used to gather information and the general conclusions at this point. More detailed support information is included in the appendices.
TEMS, Inc. / SRF Consulting Group, Inc.
December 2007
D-1
Restoration of Intercity Passenger Rail Service in the Minneapolis-Duluth/Superior Corridor
D.2: Project Description The Study will determine the feasibility, both operationally and financially, of re-instating regular longdistance intercity passenger train service between Minneapolis, Minnesota, and Duluth, Minnesota via the active Burlington Northern Santa Fe Railway freight line, passing through Cambridge, Hinckley, and Superior. The route roughly parallels State Highways 65 and 23 through Hennepin, Anoka, Isanti, Pine, Carlton, Douglas (Wisconsin), and St. Louis counties. This rail line represents the only railroad connection currently in full active service between the Twin Cities and the Twin Ports. In order to commingle 12 to 20 freight trains a day with a proposed 4-8 passenger trains in each direction, several improvements to the railroad will need to be made. Besides grade crossing safety upgrades and modernized signal systems, significant investments to construct longer sidings, station developments, and some double-tracking along the route will be necessary to maintain or improve freight capacity and operating flexibility. This in turn will insure fast and reliable scheduling of the passenger movements. The transportation improvements for this corridor are expected to promote better travel options and spur economic development in many communities along the line. At this time, stations are anticipated at Minneapolis, Coon Rapids (Foley Boulevard), Cambridge, Hinckley, Superior and Duluth. Future stations could be constructed at other communities along the corridor.
D.3
Demographic Information
Data Gathered: Year 2000 Census Data, including population, households, percent of minority population and percent of persons below the poverty level Executive Order 12898, “Federal Actions to Address Environmental Justice in Minority Populations and Low-Income Population,” dated February 1, 1994, required that environmental justice be addressed (to the greatest extend practicable and permitted by law) in all federal planning and programming activities. The purpose of Executive Order 12898 is to identify, address and avoid disproportionately high and adverse human health or environmental effects of programs, policies and activities on minority populations and low-income populations. The percentage of minority and low income population has been gathered by state, county, city (where applicable) and by census tract. A summary table comparing the States of Minnesota and Wisconsin with each county in the corridor is included below. At this stage, this report has only identified where there may be concentrations of minority population and low income population. When project construction occurs, a more detailed analysis at the census tract level should be undertaken to determine whether there will be disproportionate effects on minority and/or low income populations. Table 1-A compares Minnesota and the counties by race. The state of Minnesota has a minority population of 11 percent. None of the Minnesota counties has a higher percentage of minority population than the state. Table 1-B shows that the State of Wisconsin also showed a minority population of 11 percent, and that Douglas County had only 5 percent minority population. When compared broadly to the state, none of the counties in the corridor had a higher minority population than the state.
TEMS, Inc. / SRF Consulting Group, Inc.
December 2007
D-2
Restoration of Intercity Passenger Rail Service in the Minneapolis-Duluth/Superior Corridor
Tables 2-A and 2-B show income and poverty status for each of the counties in Minnesota and Wisconsin. In the State of Minnesota, there is 8 percent of the population that fell below the poverty level. Although Anoka and Isanti counties did not exceed the state level, Kanabec, Pine, Carlton and St. Louis counties all exceeded the state poverty level percentage. In Wisconsin, Douglas County had an 11 percent poverty level, exceeding the 9 percent state level. This data is indicative that more detailed research on a census tract level will be required for the environmental document completed for this project in the future. These percentages show that there are persons with below poverty level incomes in most of the counties in the rail corridor. The future analysis will need to determine whether there is a disproportionate effect on low income or minority populations as a result of the project.
TEMS, Inc. / SRF Consulting Group, Inc.
December 2007
D-3
143,382
Demographic Group Households Population White Minorities Black American Indian Asian or Pacific Islander Other Race Two or more Races
Hispanic Origin *
8%
N/A
380,476
4,794,144
294,583
12,367
$57,754
N/A
$47,111
N/A
4%
N/A
Anoka County Percent of Persons for Whom Number Poverty Status is Determined
2%
State of Minnesota Percent of Persons for Whom Number Poverty Status is Determined
4,961
Anoka County Percent of Number Population 106,428 N/A 298,084 100% 279,133 94% 18,951 6% 4,756 2% 2,079 1% 5,102 2% 1,930 1% 5,084 2%
TEMS, Inc. / SRF Consulting Group, Inc.
1%
30,832
1,753
$50,127
December 2007
N/A
6%
N/A
Isanti County Percent of Persons for Whom Number Poverty Status is Determined
259
Isanti County Percent of Number Population 11,236 N/A 31,287 100% 30,551 98% 736 2% 80 0% 182 1% 127 0% 53 0% 294 1%
Source: U.S. Census Bureau ** Total poverty numbers are less than population totals, as poverty status is determined from a sample of the population.
Demographic Group 1999 Median Household Income Persons Below 1999 Poverty Level Persons for Whom Poverty Status is Determined **
TABLE 1B – Minnesota Income and Poverty - 2000 Census
Source: U.S. Census Bureau * By Definition, the Hispanic Origin group also includes other racial groups.
3%
State of Minnesota Percent of Number Population 1,895,127 N/A 4,919,479 100% 4,400,282 89% 519,197 11% 171,731 3% 54,967 1% 143,947 3% 65,810 1% 82,742 2%
TABLE 1A – Minnesota Populations, Household and Race – 2000 Census
1%
14,804
1,402
$38,520
N/A
9%
N/A
Kanabec County Percent of Persons for Whom Number Poverty Status is Determined
140
Kanabec County Percent of Number Population 5,759 N/A 14,996 100% 14,587 97% 409 3% 26 0% 121 1% 71 0% 25 0% 166 1% 2%
25,111
2,831
$37,379
N/A
11%
N/A
Pine County Percent of Persons for Whom Number Poverty Status is Determined
465
Pine County Percent of Number Population 9,939 N/A 26,530 100% 25,047 94% 1,483 6% 341 1% 713 3% 88 0% 88 0% 253 1% 1%
30,174
2,389
$40,021
N/A
8%
N/A
Carlton County Percent of Persons for Whom Number Poverty Status is Determined
266
Carlton County Percent of Number Population 12,064 N/A 31,671 100% 29,057 92% 2,614 8% 308 1% 1,644 5% 115 0% 67 0% 480 2% 1%
192,585
23,211
$36,306
N/A
12%
N/A
St. Louis County Percent of Persons for Whom Number Poverty Status is Determined
1,597
St. Louis County Percent of Number Population 82,619 N/A 200,528 100% 190,211 95% 10,317 5% 1,704 1% 4,074 2% 1,387 1% 451 0% 2,701 1%
D-4
Restoration of Intercity Passenger Rail Service in the Minneapolis-Duluth/Superior Corridor
593,818 304,460 47,228 90,393 84,842 66,895
Minorities
Black
American Indian
Asian or Pacific Islander
Other Race
Two or more Races
N/A
5,211,603
41,918
4,605
$35,226
TEMS, Inc. / SRF Consulting Group, Inc.
December 2007
1%
1%
0%
1%
0%
1%
5%
95%
100%
N/A
11%
N/A
D-5
Douglas County Percent of Persons for Whom Poverty Status is Determined
315
612
85
285
0
246
2,014
41,273
43,287
Douglas County Percent of Number Population 17,808 N/A
Number
Source: U.S. Census Bureau ** Total poverty numbers are less than population totals, as poverty status is determined from a sample of the population.
9%
451,538
Persons Below 1999 Poverty Level Persons for Whom Poverty Status is Determined **
N/A
$43,791
Number
4%
1%
2%
2%
1%
6%
11%
89%
100%
State of Wisconsin Percent of Persons for Whom Poverty Status is Determined
1999 Median Household Income
DEMOGRAPHIC GROUP
TABLE 2B–Wisconsin Income and Poverty - 2000 Census
Source: U.S. Census Bureau * By Definition, the Hispanic Origin group also includes other racial groups.
192,921
4,769,857
White
Hispanic Origin *
5,363,675
State of Wisconsin Percent of Number Population 2,084,544 N/A
Population
Households
Demographic Group
TABLE 2A–Wisconsin Populations, Household And Race - 2000 Census
Restoration of Intercity Passenger Rail Service in the Minneapolis-Duluth/Superior Corridor
Restoration of Intercity Passenger Rail Service in the Minneapolis-Duluth/Superior Corridor
D.4
Historic and Archaeological Properties
Data Gathered: Data base searches of historic properties or archaeological sites that have been surveyed in Minnesota and Wisconsin. Section 106 of the National Historic Preservation Act requires federal agencies or their designees to assess the effects of their actions by identifying properties listed on, or eligible for the National Register of Historic Places (NRHP); determining effects of the project on those properties; and consulting with interested parties to determine ways to avoid, minimize, or mitigate effects caused by an undertaking. The Section 106 process will require a detailed survey of historic properties and archaeological sites in the railroad corridor when an environmental document is undertaken. For this environmental scan, data bases maintained by the State Historic Preservation Offices of Minnesota and Wisconsin have been searched to provide a general overview of historic properties and archaeological sites in the corridor. The data base searches provide an indication of historic or archaeological sites that were identified previously and may still be present. The information is organized geographically by section, and thus includes a larger area than the actual rail corridor. However, it does identify properties listed or found eligible for the National Register of Historic Places, which are afforded protection under Section 106. Although the more detailed survey required for the future environmental document will be focused on the rail corridor and may identify additional properties that are eligible for the National Register, properties that are already listed or eligible for the National Register are noted below.
Properties that are listed in the National Register of Historic Places or have been found eligible for the National Register are listed in Table 3. Detailed survey work in the corridor will be required for a future environmental document.
TEMS, Inc. / SRF Consulting Group, Inc.
December 2007
D-6
Restoration of Intercity Passenger Rail Service in the Minneapolis-Duluth/Superior Corridor
TABLE 3: National Register Listed and Determined Eligible Properties PROPERTY NAME
CITY
MINNESOTA Isanti County Isanti County Courthouse Cambridge Cambridge Post Office (eligible) Cambridge Oscar Olson House Braham Pine County Tenquist Store (eligible) Hinckley Northern Pacific Depot Hinckley Hinckley Fire Relief House Sandstone Kettle River Sandstone Company Sandstone Minneapolis Trust Company Bldg Sandstone Sandstone School Sandstone Bridge No. 5718 Sandstone Bethlehem Lutheran Church Askov Partridge Township Hall Askov P.P. Kilstofte Farmstead Askov Louis Hultgren House and Sand Pit Kerrick St. Louis County Duluth Commercial Historic District Duluth (Superior and 1st Street bet. 4th Ave. E and 4th Ave. W) Six Duluth Missabe and Iron Range Railway Bridges (eligible) Duluth Three segments of Duluth Missabe and Iron Range Railway (eligible) Duluth Portion of Lake Superior and Mississippi main line RR (eligible) Duluth Slip 6 and Slip 7 (4 Coal Docks—southwestern end Grassy Point-- eligible) Duluth WISCONSIN Douglas County All Located On Tower Avenue: Berkshire Block Superior Empire Block Superior Maryland Block Superior Massachusetts Block Superior Minnesota Block—Board of Trade Bldg. Superior New Jersey Building Superior New York Block Superior Washington Block Superior Wemyss Building Superior Located On Belknap St.: Douglas County Courthouse Superior NOTE: No archaeological sites listed or found eligible within search area in MN or WI
TEMS, Inc. / SRF Consulting Group, Inc.
December 2007
D-7
Restoration of Intercity Passenger Rail Service in the Minneapolis-Duluth/Superior Corridor
D.5: Identification of Wetland Areas Data Gathered: Identification of wetland areas using various published sources.
D.5.1 Methodology Initial analysis was completed using various sources to identify potential wetlands along the project corridor. Among the sources reviewed were the National Wetlands Inventory (NWI), USDA Natural Resource Conservation Service (NRCS) Soil Surveys, Minnesota Department of Natural Resources (MnDNR) Protected Waters Inventory (PWI), Wisconsin Wetland Inventory (WWI), Wisconsin DNR (WisDNR) streams data, aerial photographs and topographic maps. The DNR Division of Waters maintains the PWI maps that show protected water bodies under Minnesota Statutes, Section 105.42 which requires a permit be obtained before making any alterations in the course, current, or cross-section of these waters. The types of protected waters that exist under this classification are basins, ditches, and watercourses.
D.5.2 Findings Much of the existing rail line, once it leaves Anoka County, is located in the part of Minnesota that has retained greater than 80 percent of the pre-European settlement wetland area (Anoka County has between 50 percent-80 percent of pre-European settlement wetlands). Therefore, the original rail corridor was built through many wetland communities.
Anoka County, MN MnDNR protected waters adjacent to the rail corridor: Coon Creek (and tributaries), Cedar Creek, 83P, 85P, 176W, 188W, 215W, 231W, 416W, 432W, 433W, 636W. Many of the wet meadow and shallow marsh wetlands along the rail corridor in Anoka County have been affected by drainage and agricultural land use. The additional siding proposed north of Constance would impact additional wetland areas, including DNR protected waters 85P, 416W, 432W, and 433W.
Isanti County, MN MnDNR protected waters adjacent to the rail corridor: Unnamed watercourse out of 24P, Isanti Brook, 38W, 39W, 40W, 49W, 239W. Existing wetlands, mostly wet meadows and shallow marshes, just north of Bethel in Isanti County have been similarly impacted as in Anoka County by drainage and agricultural land use. The additional siding proposed from south of Isanti through to the north side of Cambridge will impact only a few wetlands, as much of the corridor has been developed, though it would likely impact DNR protected waters 40W, 49W, 239W and Isanti Brook.
Kanabec County, MN MnDNR protected waters adjacent to rail corridor: 12W, Snake River.
TEMS, Inc. / SRF Consulting Group, Inc.
December 2007
D-8
Restoration of Intercity Passenger Rail Service in the Minneapolis-Duluth/Superior Corridor
Existing wetlands, scrub shrubs and wet meadows, in Kanabec County have been impacted by drainage and agricultural land use. No additional sidings are proposed within Kanabec County, therefore, only existing wetlands, including the Snake River crossing, would be affected with any upgrades to the existing rail line.
Pine County, MN MnDNR protected waters adjacent to rail corridor: Pokegama Creek and tributaries, East Pokegama Creek, Mission Creek, Grindstone River (in Hinckley), Spring Creek, Deer Creek, Unnamed public ditch, Unnamed watercourse, Kettle River, tributary ditch to Bear Creek, Little Willow River and tributary, Willow River and tributary, tributary to South Fork Nemadji River, 33W, 122P, 155W, 156P. The mainly shallow marsh and wet meadow wetlands in the southwest portion of Pine County, up to Hinckley, through which the rail corridor runs, have been impacted by drainage and agriculture. Northeast of Hinckley, however, the boreal community dominates the landscape and there is more forested than agricultural area. Many of the wetlands northeast of Hinckley are scrub shrub and forested wetlands. Two new sidings are proposed in Pine County: 1) the Bruno siding would be constructed through over a mile of scrub shrub and shallow marsh wetland, and would cross a DNR protected tributary to Little Willow River, and 2) the Nickerson siding would be constructed through nearly a mile of forested and shallow marsh wetlands, and would cross a DNR protected tributary to the South Fork Nemadji River.
Carlton County, MN MnDNR protected waters adjacent to rail corridor: Silver Creek and tributaries, multiple tributaries to the South Fork Nemadji River. Wetlands along the rail corridor in Carlson County are limited and mainly scrub shrub and forested wetlands. The boreal community dominates in Carlton County, with steep topographic shifts around the many tributaries to the South Fork Nemadji River that flows into Wisconsin and eventually outlets in Lake Superior. A short portion of the proposed additional siding at Foxboro, WI, would cross a tributary of the South Fork Nemadji River at the eastern edge of Carlton County, and it appears that it would not impact additional wetlands.
St. Louis County, MN MnDNR protected waters adjacent to rail corridor: Stewart Creek, two unnamed creeks, Miller Creek and Buckingham Creek, 16-1P (Lake Superior). Minimal wetland resources exist in this portion of St. Louis County, and the existing rail currently crosses the indicated protected waters.
Douglas County, WI WisDNR streams adjacent to the rail corridor: Balsam Creek, Little Balsam Creek, Miller Creek, Rock Creek, Stony Brook, Nemadji River, St. Louis River, Pokegama River, Little Pokegama River, Black River, and tributaries to these streams.
TEMS, Inc. / SRF Consulting Group, Inc.
December 2007
D-9
Restoration of Intercity Passenger Rail Service in the Minneapolis-Duluth/Superior Corridor
Wetlands along the existing corridor in Douglas County, up to Boylston Junction, are mainly forested wetlands, and there are numerous crossings of the Nemadji River and its tributaries. The additional siding proposed in Foxboro would cross one of these tributaries, and it appears that it would not impact additional wetlands. North of Boylston Junction, the rail splits at Saunders, heading north into Superior and west through Pokegama into Minnesota. The north rail corridor to Superior runs mainly through developed areas where wetlands have been impacted. The proposed additional siding lies within an existing rail yard, where shallow marsh wetlands likely remain. The west rail corridor current runs through a vast scrub shrub/forested wetland complex until just west of Pokegama. There are at least five crossings of streams that flow into Lake Superior. No new sidings are proposed along this section of the rail corridor, therefore only existing wetlands may be impacted with upgrades to the existing corridor.
Conclusions Based upon the preliminary, off-site review of the wetland and water resources along the Minneapolis to Duluth High Speed Rail Corridor, there are existing wetlands that have been impacted with the original construction of the rail corridor. Some of the proposed sidings would impact additional wetland resources, including some MnDNR protected waters. Starting in Carlton County, and continuing through to the rail corridor terminus in Duluth, the existing rail corridor makes multiple crossings of watercourses located within steep ravines, and this could pose a challenge to upgrades of existing rail corridor. Only the short section of siding proposed at Foxboro has the potential to cross two of these streams.
D.6: Identification of State and Federal Parks, Wildlife Refuges Data Gathered: State and federal parks, forests and wildlife refuges were Section 4(f) of the Department of Transportation Act of 1966 states that it is in the national interest to preserve the natural beauty of the countryside, public park and recreation lands, wildlife and waterfowl refuges and historic sites. The law requires that the Secretary of Transportation approve a project requiring the use of publicly owned parks, recreational areas, and wildlife and waterfowl refuges of nation, state or local significance, or privately owned lands of national historic significance only where it can be shown that: (1) no feasible and prudent alternative to the use of such land exists and (2) such a project includes all possible planning to minimize harm to the Section 4(f) land resulting from such use. Some of the parkland identified in the corridor is also subject to Section 6(f) of the Land and Water Conservation Act (LAWCON), which requires that any park that receives LAWCON funds be protected from conversions to non-recreation uses. Potential impacts to parks with LAWCON funding must be reviewed by the state Department of Natural Resources and the National Park Service. Facilities within approximately one mile of the corridor have been identified for this environmental scan. Of this list, a review of maps shows the rail corridor appears to travel through the state or federal parks or wildlife refuges listed in Table 4. This preliminary information should be field verified during the preparation of an environmental document.
TEMS, Inc. / SRF Consulting Group, Inc.
December 2007
D-10
Restoration of Intercity Passenger Rail Service in the Minneapolis-Duluth/Superior Corridor
TABLE 4 State and Federal Parks and Wildlife Refuges Adjacent to or within rail corridor PARK NAME
COUNTY
LOCATION
Anoka
Oak Grove
Pine
Sandstone
*DAR State Forest
Pine
Partridge Township
Nemadji State Forest
Pine
Nickerson Township
Robert/Marilyn Burman Wildlife Management Area *Banning State Park
Willard Munger State Trail
*
D.7
Pine, Carlton and St. Louis
Saunders State Trail
Douglas
Superior Township
Statewide Natural Area
Douglas
Superior City
Parks with LAWCON funding
Identification of County and Local Parks
Data Gathered: County and local parks were identified by maps, website and some site visits for each jurisdiction. Section 4(f) and Section 6(f) regulations also apply to county and local parks. Where communities are large, including Coon Rapids, Andover, Cambridge, Superior and Duluth, only parks within approximately one mile of the rail corridor are included. In smaller communities, all known parks have been listed. The table also identifies six parks that are subject to LAWCON reviews should there be any impact resulting from the project. A detailed analysis of any impacts to parks should be undertaken during a future environmental document.
D.8
Threatened and Endangered Species
Data Gathered: A review of threatened and endangered species and native plant communities in sections along the railroad corridor was made to the Minnesota DNR. Similar information was gathered from the Wisconsin DNR. The Minnesota DNR identified 248 known occurrences of rare species and native plant communities in the sections along the rail corridor. The DNR further identified those elements that may be impacted by this project. For the rail project, the DNR identified Blanding’s Turtle, native plant communities, and prairie remnants as most likely to be impacted in various locations along the corridor. The DNR also noted that wood turtles in the Net and Nemadji rivers, and mussels in the Grindstone, Snake, Kettle and St. Louis rivers may be affected if there is any work, such as bridge construction, in the rivers. Information in Wisconsin was identified using the Wisconsin DNR’s listings of threatened and endangered species, and has been identified according to township, range and section.
TEMS, Inc. / SRF Consulting Group, Inc.
December 2007
D-11
Restoration of Intercity Passenger Rail Service in the Minneapolis-Duluth/Superior Corridor
D.8
Field Trip
On October 17 and 19, 2007, staff visited a number of the smaller communities along the corridor to view the setting of the railroad and potential concerns about the potential impact of high-speed trains on the community. This supplementary information is included to provide some direction in understanding nearby land uses for a future environmental document.
ANOKA COUNTY Coon Rapids Unlike many older communities, Coon Rapids developed after the railroad was already established. Neighborhoods as well as parks have been developed all along the railroad. As a result, there are numerous crossing locations in areas of Coon Rapids with single-family and multi-family housing, manufactured housing, commercial and industrial property, and near parks.
Anoka County There are several crossings through Anoka County located in largely rural areas, as well as in developing areas with new houses adjacent to the crossings. Although the crossings are marked, not all of them have cross arms to warn vehicular or pedestrian traffic. In at least one case, on 221st Street, there is a path next to the railroad that appears to handle ATV traffic.
Bethel The railroad runs along the east edge of the community, with a small Main Street running perpendicular to the railroad. The railroad must be crossed to enter the community.
ISANTI COUNTY Isanti The City of Isanti is growing and contains both an older core community with a small downtown area as well as many new houses and businesses being developed around the edges of the community. The railroad runs through the heart of the community, with at least three crossings, and commercial, park and residential uses near the various crossings.
Cambridge In Cambridge, the rail line runs parallel to Main Street, approximately one block to the east. There is residential, commercial and industrial development all along the line that has developed over the years, as well as redevelopment in the downtown area. Cambridge has limited the railroad crossings in the city to only a few locations. One main crossing is Highway 95, which runs through the downtown and then east to a major regional shopping center east of the intersection of Highway 95 and Highway 65.
Braham
TEMS, Inc. / SRF Consulting Group, Inc.
December 2007
D-12
Restoration of Intercity Passenger Rail Service in the Minneapolis-Duluth/Superior Corridor
The railroad runs through the center of Braham, immediately adjacent to Highway 107, which also serves as a Main Street. There is a small pocket park (Freedom Park) located between the highway and the railroad, along with a drive-in bank. Approximately half of the city’s residential neighborhoods are east of the railroad, with the other half to the west. The large high school at Braham is located to the south west of the city and would require crossing the railroad for residents to the east.
PINE COUNTY Hinckley The railroad cuts diagonally through Hinckley, and has no fewer than five crossings of primarily residential streets and Old Highway 61. There are residences, churches, the high school, historic sites, and parks immediately adjacent to the railroad in its path across the city. Although field observations identified the very slow speeds of the trains through Hinckley, and there are gate crossings at all locations, there are still multiple crossings where vehicles, bicycles and pedestrian traffic should be anticipated.
Sandstone At Sandstone the railroad runs adjacent to Highway 64 and across from Main Street businesses. “Railroad Park” lies between the highway and the railroad. There are several older buildings along Main Street and one Main Street property on the National Register of Historic Places. As the railroad leaves Sandstone, it crosses the Kettle River on a high, scenic bridge. The Kettle River has been designated by the DNR as a wild and scenic river.
Askov The railroad runs through the middle of Askov, a community that has adopted Danish names for its streets in honor of its Danish heritage. Main Street runs perpendicular to the railroad; there are houses that face the railroad, as well as a warehouse (potentially historic) adjacent to the tracks.
Superior Due to the location of the tracks in established rail yards, no visit was undertaken in Superior.
Duluth Due to the location of the tracks in established rail yards, no visit was undertaken in Duluth.
TEMS, Inc. / SRF Consulting Group, Inc.
December 2007
D-13
Restoration of Intercity Passenger Rail Service in the Minneapolis-Duluth/Superior Corridor
Appendix E Timetables
TEMS, Inc. / SRF Consulting Group, Inc.
December 2007
E-1
C #7003 6:10 6:21 7:10 7:34 7:56 8:10
A #7001
Trainset Southbound Duluth Depot Superior Sandstone Hinckley Cambridge Foley Blvd Northstar
A #7005 9:10 9:21 10:10 10:34 10:56 11:10
C #7004 11:50 12:02 12:23 12:47 13:36 13:50 B #7007 11:35 11:46 12:35 12:59 13:21 13:35
A #7006 14:15 14:27 14:48 15:12 16:01 16:15 C #7009 14:00 14:11 15:00 15:24 15:46 16:00
B #7008 16:40 16:52 17:13 17:37 18:26 18:40 A #7011 16:25 16:36 17:25 17:49 18:11 18:25
C #7010 17:15 17:27 17:48 18:12 18:20
19:07 19:15 19:39 20:01 20:15
C #7013
A #7012 19:05 19:17 19:38 20:02 20:51 21:05 B #7015 18:50 19:01 19:42 19:50 20:14 20:36 20:50
C #7014 21:00 21:12 21:33 21:57 22:05
23:07 23:15 23:39 0:00 0:15
C #7017
B #7016 23:05 23:17 23:38 0:02 0:10
TEMS, Inc. / SRF Consulting Group, Inc.
December 2007
Equipment Rotations: Train A: 7001-7000-7005-7006-7011-7012 (Starts in Sandstone, ends in Duluth) Train B: 7002-7007-7008-7015-7016 (Starts in Northstar, ends in Sandstone) Train C: 7003-7004-7009-7010-7013-7014-7017 (Starts in Duluth, ends in Northstar)
Note 1: Highlighted Meets shown at Cambridge occur at Cambridge siding, which includes the station stop. Note 2: Highlighted Meets shown at Hinckley occur at Hinckley-Brook Park siding, which is about 6 min south of Hinckley Casino stop.
5:37 5:45 6:09 6:31 6:45
B #7002 9:25 9:37 9:58 10:22 11:11 11:25
A #7000 7:00 7:12 7:33 7:57 8:05 8:46 9:00
Trainset Northbound Northstar Foley Blvd Cambridge Hinckley Sandstone Superior Duluth Depot
110/6+9 Scenario Schedules
E-2
Restoration of Intercity Passenger Rail Service in the Minneapolis-Duluth/Superior Corridor
Restoration of Intercity Passenger Rail Service in the Minneapolis-Duluth/Superior Corridor
Appendix F RightTrack™ Business Planning Software
TEMS, Inc. / SRF Consulting Group, Inc.
December 2007
F-1
TEMS is an innovator in systems and software design. TEMS uses its extensive industry experience to develop systems that provide an interface between tactical, day-to-day management problems and overall corporate and public goals of the industry. TEMS’ systems are user-friendly and easily accessible by engineers and planners with little or no computer expertise. They prioritize the decision-making process and interact directly with both existing and developing databases.
MANAGEMENT INFORMA TION NFORMATION AND
PL ANNING SYSTEMS
TEMS designed the RightTrack™ Business Planning System, a suite of software that operates interactively to formulate alternative scenarios in order to optimize outcomes by balancing capital investment and projected ridership and revenue. TEMS’ team of experienced specialists analyze the output generated by the system and make informed recommendations to clients from federal, state, and local government agencies; railroad companies; international development organizations; banks; and a wide range of industrial and commercial companies. The RightTrack™ system is designed to interface with condensed profiles, timetables, track condition, and other databases already in existence. The system incorporates an “Interactive Analysis” that allows a wide range of demand, revenue, technology, service levels, capital investment, and right-of-way condition issues to be assessed by a “what if” evaluation of possible options. In this way, “fatal flaws” can be identified and more favorable options developed.
TEMS
RightTrack™ enables transportation planners to: Develop realistic operating strategies that relate ridership and revenues to a specific level and quality of service. Rapidly evaluate and re-evaluate different route (speed), technology (speed), operations (service levels), and ridership (fare) options. Identify the capital investment needed to maintain track and other infrastructure at the optimum level for a given rail service. Interpret traveler behavior to determine the level and quality of service that create incentives for train use. Maximize ridership and revenues while minimizing costs by achieving a balance among service, operations, and infrastructure investment. Evaluate projects in terms of their financial return, user benefits, and the increase in jobs, income, and development opportunities.
TRACKMAN™ (Track Inventory System) is a corridor track inventory and assessment system that analyzes track infrastructure and estimates the cost of upgrading for various scenarios. It stores, on a milepost-by-milepost basis, data on track condition and track geometry such as curvature, gradient, and turnouts; structures such as bridges, crossings, and stations; maximum operating speeds; and unit costs for engineering improvements.
planner with a highly sophisticated, yet easy-to-use tool for creating and analyzing rail operations schedules. LOCOMOTION™ also provides a single, easily accessible source of detailed information on rail corridor characteristics and attainable train speeds. The system creating and altering train technologies enables users to describe their acceleration and deceleration profiles. With LOCOMOTION™, it is possible to model rail corridors, create timetables for different train technologies, and produce speed profile and operating diagrams. LOCOMOTION™ interfaces with TRACKMAN™, producing a complete graph profile for a given route.
MISS-IT™ (Major Interlocking Signaling System-Interactive Train Planner) is an
planning tool that assists rail, highway, air, and transit management in planning their systems. COMPASS™ generates ridership forecasts; revenue estimates; and rail, highway, air, and transit market shares over a given timeframe for a variety of conditions. Forecasts are made over a 25 year time frame and fares can be optimized using revenue yield analysis. COMPASS™ provides both sensitivity and risk analysis.
GOODS™ (General Optimization of Distribution Systems) is a modeling framework designed to support the analysis of freight traffic flows at the regional or urban level. The model uses data on current traffic flows, regional economic growth potentials, and specific industrial development proposals to develop total freight traffic flows and forecasts. The evaluation processes of the GOODS™ model include both financial and economic analyses that identify the commercial potential of new transportation infrastructure, as well as the economic benefits to users and surrounding communities. COMPASS™ to estimate the financial and economic benefits of a project. This includes financial return (operating ratio, NPV and IRR), economic return (gross and net consumer surplus, NPV, and cost benefit ratio), and community benefits (changes in household income, employment by sector, property values, and population) that result from infrastructure and technology improvements or train and fare modifications.
TEMS
RENTS™ (Financial and Economic Analysis Model) uses output from
PL ANNING SYSTEMS
COMPASS™ (Demand Forecasting System) is a comprehensive strategic policy
AND
event-based conflict resolution model designed to increase rail system efficiency. The system draws together track infrastructure data stored in TRACKMAN™ and the timetables generated with LOCOMOTION™ to determine the interaction of trains on a specified corridor. MISS-IT™ uses data on existing infrastructure, such as sidings and double-track, and makes decisions regarding delays and procedures based on given priorities. MISS-IT™ tests the effects of additional infrastructure on a given route and determines whether these changes create or alleviate bottlenecks within the system. The system is capable of displaying outputs in an animated graphics mode.
MANAGEMENT INFORMA TION NFORMATION
LOCOMOTION™ (Train Performance Calculator) provides the rail operations
Restoration of Intercity Passenger Rail Service in the Minneapolis-Duluth/Superior Corridor
Appendix G Innovative Financing
TEMS, Inc. / SRF Consulting Group, Inc.
December 2007
G-1
NEW_BR1_Final Cover_Apr 02.qxd
4/29/02
2:59 AM
Page 1
Innovative Finance
Federal Highway Administration U.S. Department of Transportation
NEW_BR1_FinalLayOut_Apr 02.qxd
4/29/02
12:40 AM
Page i
Message From the Federal Highway Administrator I am pleased to present the Federal Highway Administration’s Innovative Finance Brochure, containing brief descriptions of Federal financing techniques and programs that can help you bridge the investment gap between available resources and transportation infrastructure needs. Our commitment is to continue working with the transportation community, both public and private, to expand project financing opportunities to help meet the Nation’s transportation investment needs. I believe you will find this a useful brochure. For more information about these innovative finance techniques, please consult the Federal Highway Administration’s Innovative Finance Primer.
Mary E. Peters Federal Highway Administrator
NEW_BR1_FinalLayOut_Apr 02.qxd
4/29/02
12:40 AM
Page ii
T
his Innovative Finance Brochure describes techniques for funding transportation facilities. Through this brochure and a companion Innovative Finance Primer, the Federal Highway Administration seeks to highlight innovative project finance and encourage new approaches for narrowing the gap between capital needs and financial resources.
Alameda Corridor An innovative $400 million Federal loan for the Alameda Corridor Project filled a key financing gap for this $2.4 billion multimodal project, and provided a model for Federal assistance that led to enactment of the TIFIA Federal credit program. Photo Credit: Alameda Corridor Transportation Authority
NEW_BR1_FinalLayOut_Apr 02.qxd
4/29/02
12:40 AM
Page iii
TABLE OF CONTENTS Paving the Way For Innovation
1
What is Innovative Finance?
1
Innovative Finance Toolbox
2
Innovative Management of Federal Funds
4
Advance Construction and Partial Conversion of Advance Construction Tapered Match Flexible Match
4 5 6
Toll Credits
7
Grant Anticipation Revenue Vehicles (GARVEEs) Credit Assistance
8 10
Section 129 Loans
10
State Infrastructure Banks (SIBs) Transportation Infrastructure Finance and Innovation Act (TIFIA)
12
For More Information
14
16
NEW_BR1_FinalLayOut_Apr 02.qxd
PAVING
THE
WAY
4/29/02
12:40 AM
Page 1
FOR INNOVATION
In 1994, the Federal Highway Administration (FHWA) launched a major initiative to identify barriers to highway infrastructure investment and develop strategies to overcome them. Under the experimental “Test and Evaluation” program, designated as TE-045, FHWA sought proposals from states for alternatives to traditional financing approaches. The program produced an array of innovative financing techniques that increased the financial flexibility available to states. These new techniques move the transportation financing process from a single strategy of grant reimbursement to a diversified approach that provides new options for both the public and private sectors. This brochure, which complements a detailed Innovative Finance Primer, highlights several of the techniques and strategies that have been advanced by the FHWA in partnership with the states and other transportation stakeholders. It also provides a list of resources, including publications, web sites, and expert technical assistance, that can help states and other project sponsors make use of these new techniques.
WHAT
IS INNOVATIVE
FINANCE?
The term “innovative finance” for transportation describes techniques that supplement traditional highway financing methods. While many of these techniques may be well tested in other areas, their application to transportation is innovative. Historically, FHWA has financed highways through grants that generally fund up to 80 percent of project costs. Since this approach alone has not met the nation’s transportation investment needs, U.S. DOT’s innovative finance initiatives are needed to supplement the traditional grant program. The primary objectives of innovative finance are to: Maximize the ability of states and other project sponsors to leverage Federal capital for needed investment in the nation’s transportation system; More effectively utilize existing funds; Move projects into construction more quickly than under traditional financing mechanisms; and Make possible major transportation investments that might not otherwise receive financing. 1
NEW_BR1_FinalLayOut_Apr 02.qxd
4/29/02
12:40 AM
Page 2
THE INNOVATIVE FINANCE TOOLBOX Since launching its innovative finance initiative with TE-045, FHWA has advanced many techniques to supplement traditional transportation funding programs. Many of the innovations proposed under the TE-045 initiative were enacted into law under the National Highway System Designation Act (NHS Act) of 1995. The Transportation Equity Act for the 21st Century (TEA-21), enacted in 1998, made further strides in broadening project sponsors’ options for financing Federally-assisted highway projects. As states and private sector sponsors look to innovative finance options, it is important to recognize the potential synergy in combining techniques to advance a project. Marketable Revenue Projects State Infrastructure Banks Revenue Projects Requiring Credit Assistance
Funds Management Techniques
Traditional Non-Revenue Projects
Section 129 Loans TIFIA
GARVEE Bonds
The base of the pyramid represents the majority of highway projects that continue to rely primarily on grant-based funding, but may benefit from measures that enhance flexibility and maximize resources. Various Federal funds management techniques, such as advance construction, tapered match, and grant-supported debt through Grant Anticipation Revenue Vehicles or GARVEE bonds, can help move these projects to construction more quickly. The mid-section of the pyramid represents those projects that can be partially financed with project-related revenues, but may also require some form of public credit assistance to be financially viable. State Infrastructure Banks can assist state, regional, and local projects through low-interest loans, loan guarantees, and other credit enhancements. State loans of 2
NEW_BR1_FinalLayOut_Apr 02.qxd
4/29/02
12:41 AM
Page 3
Federal grant funds known as Section 129 loans represent another credit assistance technique. The Transportation Infrastructure Finance and Innovation Act (TIFIA) program provides credit assistance to large-scale projects of regional or national significance that might otherwise be delayed or not constructed at all because of risk, complexity, or cost. The peak of the pyramid reflects the very small number of projects able to secure private capital financing without any governmental assistance. These self-supporting projects are typically developed on high-volume corridors where revenues from user fees are sufficient to cover capital and operating costs. These techniques are discussed in the following sections.
New Mexico State Road 44 A GARVEE bond approach has enabled the expansion of New Mexico 44 in a significantly reduced time frame compared to traditional funding approaches. Photo Credit: Mesa, PDC
3
NEW_BR1_FinalLayOut_Apr 02.qxd
4/29/02
12:41 AM
Page 4
INNOVATIVE MANAGEMENT
OF
FEDERAL FUNDS
ADVANCE CONSTRUCTION AND OF ADVANCE CONSTRUCTION
PARTIAL CONVERSION
Advance construction (AC) and partial conversion of advance construction (PCAC) are cash flow management tools that allow states to begin projects with their own funds and later convert these projects to Federal assistance.
How does it work? AC allows a state to construct Federal-aid projects in advance of the apportionment and obligation of authorized Federal-aid funds. Under normal circumstances, states can “convert” advance-constructed projects to Federal-aid at any time sufficient Federal-aid funds and obligation authority are available. States may either convert and obligate the entire eligible amount, based on funding availability or, using PCAC, may obligate funds in stages. PCAC allows states to convert, obligate, and receive reimbursement for a portion of the Federal share of project costs, removing the need to wait until the full amount of obligation authority is available. PCAC is used in conjunction with GARVEE bonds when Federal funds are obligated for debt service payments over a period of time.
What are the benefits? AC can help facilitate construction of large projects, while maintaining obligation authority for smaller projects. PCAC eliminates a major single year “draw down” of Federal funds, and obligation of funds for the entire Federal share of a project, thereby making Federal-aid funds available to support a greater number of projects. This partial conversion technique can enable completion of a project earlier than under the conventional approach, avoiding construction cost inflation, and bringing the benefits of a completed facility to the public at an earlier date. How is it used? States have been using AC for a wide range of projects to expedite project construction, begin projects sooner, and improve cash flow. The Connecticut DOT advanced a $55.4 million major bridge project through partial conversion of a $35.7 million component. Connecticut spread its Federal-aid obligations for the project over two years, enabling it to redirect some funds to other smaller bridge projects. 4
NEW_BR1_FinalLayOut_Apr 02.qxd
4/29/02
12:41 AM
Page 5
TAPERED MATCH Tapered match enables the project sponsor to vary the non-Federal share of a Federal-aid project during development and construction so long as the total Federal contribution toward the project does not exceed the Federal-aid limit.
How does it work? Under the tapered match approach, the non-Federal matching ratio is imposed on projects rather than individual payments. Therefore, Federal reimbursements of state expenditures can be as high as 100 percent in the early phases of a project provided that, by the time the project is complete, the overall Federal contribution does not exceed the Federal-aid limit established when the project was authorized. To ensure effective management of Federal funds, FHWA limits the use of tapered match to situations that result in expediting project completion, reducing project costs, or leveraging additional non-Federal funds.
What are the benefits? Tapered match may be most useful in cases where the project sponsor of a Federal-aid project lacks sufficient funds to match Federal grants at the start of the project, but expects to accumulate the match in time for project completion. Tapering may also be beneficial when a project sponsor needs to overcome a near-term gap in state matching funds, thereby avoiding delays in getting the project underway. Tapering also allows a sponsor to advance a project before fully securing capital market financing. How is it used? This technique may be used to facilitate a project when a new local transportation tax has been enacted, but revenue collections have yet to accumulate sufficient matching funds. Using tapered match, the project can move forward immediately with 100 percent Federal funds, allowing time for the tax revenues to accumulate. The locally generated revenues would be used to fund the final 20 percent share of project costs. In Washington State, tapered match enabled the state DOT to proceed with a $35.9 million high-occupancy vehicle-lane project when state expenditure limits threatened to delay the project by more than a year. The DOT obtained Federal reimbursement of 100 percent of its project expenditures until a new budget cycle provided the spending authority for the state share.
5
NEW_BR1_FinalLayOut_Apr 02.qxd
4/29/02
12:41 AM
Page 6
FLEXIBLE MATCH Flexible match allows a wide variety of public and private contributions to be counted toward the non-Federal match of Federal-aid projects.
How does it work? The NHS Act and TEA-21 introduced new flexibility to the matching requirements for the Federal-aid program by allowing certain public donations of cash, land, materials, and services to satisfy the non-Federal matching requirement. These matching options include: The value of private and certain state and local contributions, including publicly-owned property; Funds from other Federal agencies may count toward the non-Federal share of recreational trails and transportation enhancement projects; Funds from the Federal Lands Highway Program may be applied as non-Federal match for projects within or providing access to Federal or Indian lands; and Funds from Federal land management agencies may be used as the match for most Federal-aid highway projects. Also states may seek program-wide approval for Surface Transportation Program (STP) projects. The matching requirement would then apply to the program instead of individual projects.
What are the benefits? Flexible match provisions increase a state’s ability to fund its transportation programs by: Accelerating certain projects that receive donated resources; Allowing states to reallocate funds that otherwise would have been used to meet Federal-aid matching requirements; and Promoting public-private partnerships by providing incentives to seek private donations.
How is it used? In Maine, flexible match was used to advance the construction of an Auburn intermodal truck/rail transfer facility. The value of the private railroad’s contribution of materials, equipment, and labor was credited toward the match. 6
NEW_BR1_FinalLayOut_Apr 02.qxd
4/29/02
12:41 AM
Page 7
TOLL CREDITS States may apply toll revenues used for capital expenditures to build or improve public highway facilities as a credit toward the non-Federal share of certain transportation projects.
How does it work? Toll credits are earned when a state, a toll authority, or a private entity funds a capital highway investment with toll revenues from existing facilities. The amount of toll revenues spent on non-Federal highway capital improvement projects earns the state an equivalent dollar amount of credits to apply to the non-Federal share of a Federal-aid project. To utilize this tool, the state must certify that its toll facilities are properly maintained and must pass an annual maintenance of effort test to earn credits. By using toll credits to substitute for the required non-Federal share on a Federal-aid project, Federal funding can effectively be increased to 100 percent. What are the benefits? Toll credits provide states with more flexibility in financing projects. For example, by using toll credits, 1) Federal-aid projects can be advanced when matching funds are not available, 2) state and local funds normally required for matching may then be directed to other transportation projects, or 3) project administration may be simplified when a single funding source is used. States wishing to take advantage of the toll credit provision must apply toll revenues to capital improvements and meet the maintenance of effort test that may result in an increased investment in transportation infrastructure. How is it used? Toll credits are being used extensively by states with toll facilities. At the end of FY 2001, 20 states had accumulated $9.2 billion in toll credits. The credits are being applied in a variety of ways, depending on the state’s needs. Missouri reserves its toll credits for situations where project matching funds are unavailable in order to increase Federal funding to 100 percent of project costs. Ohio uses toll credits as a match on GARVEE projects and also shares its toll credits with local government agencies for both highway and transit projects. The Florida DOT has been applying toll credits on a statewide basis since 1993. Today the state is using toll credits on almost every new Federalaid project, so that most of its Federal highway program is 100 percent Federally funded, freeing up state dollars for state-administered projects. 7
NEW_BR1_FinalLayOut_Apr 02.qxd
4/29/02
12:41 AM
Page 8
GRANT ANTICIPATION REVENUE VEHICLES (GARVEE) GARVEEs enable states to pay debt service and other bond-related expenses with future Federal-aid highway apportionments.
How does it work? A Grant Anticipation Revenue Vehicle or GARVEE is a debt financing instrument authorized to receive Federal reimbursement of debt service and related financing costs under Section 122 of Title 23, United States Code. GARVEEs can be issued by a state, a political subdivision of a state, or a public authority. States can receive Federal-aid reimbursements for a wide array of debt-related costs incurred in connection with an eligible debt financing instrument, such as a bond, note, certificate, mortgage, or lease. Reimbursable debt-related costs include interest payments, retirement of principal, and any other cost incidental to the sale of an eligible debt instrument.
Colorado GARVEE Colorado sold $1 billion of GARVEEs as part of a planned $1.7 billion bond offering to help finance corridor improvements throughout the state, including Denver’s I-25 Southeast Corridor project, known as T-REX. Photo Credit: Colorado Department of Transportation
In general, projects funded with the proceeds of a GARVEE debt instrument are subject to the same requirements as other Federal-aid projects with the exception of the reimbursement process. Instead of reimbursing construction costs as they are incurred, the reimbursement of GARVEE project costs occurs when debt service is due. For a GARVEE, a state may request partial conversion of AC project(s) to coincide with debt service payments, allowing for effective use of obligation authority. It is important to note that, in order to issue GARVEE bonds, states or the issuing entity must have the appropriate state authorizations related to debt issuance. States have the flexibility to tailor GARVEE financings to accommodate state fiscal and legal conditions. 8
NEW_BR1_FinalLayOut_Apr 02.qxd
4/29/02
12:41 AM
Page 9
What are the benefits? The GARVEE financing mechanism generates up-front capital for major highway projects at tax-exempt rates and enables a state to construct a project earlier than using traditional pay-as-you-go grant resources. With projects in place sooner, costs are lower due to inflation savings and the public realizes safety and economic benefits. By paying via future Federal highway reimbursements, the cost of the facility is spread over its useful life, rather than just the construction period. GARVEEs can expand access to capital markets, as a supplement to general obligation or revenue bonds. How is it used? Candidates for GARVEE financing are typically large projects (or a program of projects) that have the following characteristics: The costs of delay outweigh the costs of financing; Other borrowing approaches may not be feasible or are limited in capacity; They do not have access to a revenue stream and other forms of repayment are not feasible; and The sponsors are willing to reserve a portion of future year Federalaid highway funds to satisfy debt service requirements. States are finding GARVEEs to be an attractive financing mechanism to bridge funding gaps and accelerate construction of major corridor projects. Ohio, the first state to leverage Federal dollars through GARVEEs, sold three GARVEE issues in the FY 1998-2001 period, totaling $190 million. The proceeds of these issues are helping to finance SpringSandusky corridor improvements, the new Maumee River Bridge, and the Southeast Ohio Plan. Colorado is advancing a multi-billion dollar program of strategic statewide projects, including the multimodal Southeast Corridor project, through planned GARVEE financings expected to total $1.7 billion. In Arkansas, GARVEE bonds, expected to total $575 million, are helping to accelerate the financing of 380 miles of Interstate improvements.
9
NEW_BR1_FinalLayOut_Apr 02.qxd
4/29/02
12:41 AM
Page 10
CREDIT ASSISTANCE SECTION 129 LOANS Section 129 loans allow states to use regular Federal-aid highway apportionments to fund loans to projects with dedicated revenue streams.
How does it work? A state may directly lend apportioned Federal-aid highway funds to toll and non-toll projects. A recipient of a Section 129 loan can be a public or private entity and is selected according to each state’s specific laws and process. A dedicated repayment source must be identified and a repayment pledge secured. The Federal-aid loan may be for any amount, up to the maximum Federal share of 80 percent of the total eligible project costs. A loan can be made for any phase of a project, including engineering and right-of-way acquisition, but cannot include costs prior to loan authorization. A state can obtain immediate reimbursement for the loaned funds up to the Federal share of the project cost. Loans must be repaid to the state, beginning five years after construction is completed and the project is open to traffic. Repayment must be completed within 30 years from the date Federal funds were authorized for the loan. States have the flexibility to negotiate interest rates and other terms of Section 129 loans. The state is required to spend the repayment funds for a project eligible under Title 23.
What are the benefits? States can use Section 129 loans to assist public-private partnerships, by enhancing start-up financing for toll roads and other privately sponsored projects. Because loan repayments can be delayed until five years after project completion, this mechanism provides flexibility during the rampup period of a new toll facility. Loans can also play an important role in improving the financial feasibility of a project by reducing the amount of debt that must be issued in the capital markets. In addition, if the Section 129 loan repayment is subordinate to debt service payments on revenue bonds, the senior bonds may be able to secure higher ratings and better investor acceptance.
10
NEW_BR1_FinalLayOut_Apr 02.qxd
4/29/02
12:41 AM
Page 11
How is it used? If a project meets the test for eligibility, a loan can be made at any time. Federal-aid funds for loans may be authorized in increments through advance construction procedures, and are obligated in conjunction with each incremental authorization. The state is considered to have incurred a cost at the time the loan, or any portion of it, is made. Federal funds will be made available to the state at the time the loan is made. The President George Bush Turnpike Project in Texas exemplifies how a Section 129 loan can play an essential role in the total financing package. This project links four freeways and the Dallas North Tollway to form the northern half of a circumferential route around the City of Dallas. Primary funding for this $940 million project included a low interest, long-term Section 129 loan and revenue bonds. This $135 million loan was critical in ensuring the affordability of the project’s senior bonds. Completion of this important beltway extension will be accomplished at least a decade sooner than would have been possible under traditional payas-you-go-financing. President George Bush Turnpike A $135 million Section 129 loan was instrumental in providing Texas with the bonding capacity needed to pay for the $940 million President George Bush Turnpike Project and greatly enhanced the creditworthiness of $446 million in revenue bonds issued for the first four segments of the project. Photo Credit: North Texas Tollway Authority
11
NEW_BR1_FinalLayOut_Apr 02.qxd
4/29/02
12:41 AM
Page 12
STATE INFRASTRUCTURE BANKS State Infrastructure Banks (SIBs) are revolving infrastructure investment funds for surface transportation that are established and administered by states.
How does it work? A SIB functions as a revolving fund that, much like a bank, can offer loans and other credit products to public and private sponsors of Title 23 highway construction projects or Title 49 transit capital projects. Federally capitalized SIBs were first authorized under the provisions of the NHS Act. The pilot program was originally available to only 10 states, and was later expanded to include 38 states and Puerto Rico. TEA-21 established a new pilot program for the states of California, Florida, Missouri, and Rhode Island. The initial infusion of Federal and state matching funds was critical to the start-up of a SIB, but states have the opportunity to contribute additional state or local funds to enhance capitalization. SIB assistance may include loans (at or below market rates), loan guarantees, standby lines of credit, letters of credit, certificates of participation, debt service reserve funds, bond insurance, and other forms of non-grant assistance. As loans are repaid, a SIB’s capital is replenished and can be used to support a new cycle of projects.
Arizona SIB Arizona’s SIB has entered into 23 loan agreements valued at $373 million, helping advance highway projects throughout the state, including the Price Freeway, a critical segment in the Phoenix area regional freeway system. Photo Credit: Arizona Department of Transportation
South Carolina SIB South Carolina’s SIB has approved financing and begun development of projects valued at nearly $3.0 billion, including the $387 million Conway Bypass to improve access to popular Myrtle Beach. Photo Credit: South Carolina Department of Transportation
12
NEW_BR1_FinalLayOut_Apr 02.qxd
4/29/02
12:41 AM
Page 13
SIBs can also be structured to leverage additional resources. A “leveraged” SIB would issue bonds against its capitalization, increasing the amount of funds available for loans.
What are the benefits? SIBs complement traditional funding techniques and serve as a useful tool to meet project financing demands, stretching both Federal and state dollars. The primary benefits of SIBs to transportation investment include: Flexible project financing, such as low interest loans and credit assistance that can be tailored to the individual projects; Accelerated completion of projects; Incentive for increased state and/or local investment; Enhanced opportunities for private investment by lowering the financial risk and creating a stronger market condition; and Recycling of funds to provide financing for future transportation projects.
How is it used? While the authorizing Federal legislation establishes basic requirements and the overall operating framework for a SIB, states have customized the structure and focus of their SIB programs to meet state-specific requirements. A variety of types of financing assistance can be offered by a SIB, with loans the most popular form of SIB assistance. As of September 30, 2001, 32 states had entered into 245 loan agreements with a dollar value of over $2.8 billion. Two states, Minnesota and South Carolina, have leveraged their SIBs through the issuance of bonds. Since its inception, the South Carolina Transportation Infrastructure Bank has approved financing and begun development of $3.0 billion in projects for eight applicants. This SIB financing mechanism is helping to condense 27 years of projects into seven years. Florida has a very active SIB with 32 loan agreements executed through the end of FY 2001, at a value of $465 million. Because of loan demands, Florida’s SIB has been augmented with a phased-in state fund appropriation of $150 million. Ohio and Arizona also have contributed additional state funds to their SIBs.
13
NEW_BR1_FinalLayOut_Apr 02.qxd
4/29/02
12:41 AM
Page 14
TRANSPORTATION INFRASTRUCTURE FINANCE AND INNOVATION ACT (TIFIA) TIFIA allows U.S. DOT to provide direct credit assistance to sponsors of major transportation projects.
How does it work? The TIFIA credit program offers three distinct types of financial assistance – direct loans, loan guarantees, and standby lines of credits. These instruments are designed to address the varying requirements of projects throughout their life cycles. The amount of Federal credit assistance may not exceed 33 percent of total eligible project costs. TIFIA project sponsors may be public or private entities, including state and local governments, special purpose authorities, transportation improvement districts, and private firms or consortia. Any type of project eligible for Federal assistance through existing surface transportation programs (both highways and transit) is eligible for TIFIA assistance. In addition, the following types of projects are eligible: international bridges and tunnels; inter-city passenger bus and rail facilities and vehicles; and publicly-owned intermodal freight transfer facilities on or adjacent to the National Highway System. Miami Intermodal Center TIFIA credit assistance backed by a regional gas tax and daily rental car fees helped complete the financing for the $1.3 billion Miami Intermodal Center, designed to improve access to and within Miami International Airport, a global gateway for national and international trade and commerce. Photo Credit: Florida Department of Transportation
TIFIA assistance involves an application process and each project must meet certain threshold criteria to apply. The project’s estimated eligible costs must be at least $100 million or 50 percent of the state’s annual Federal-aid highway apportionments, whichever is less, or at least $30 million for intelligent transportation systems (ITS) projects. The project must be supported in whole or part from user charges or other non-Federal dedicated funding sources and be included in the state’s Transportation Plan. The project is subject to all Federal requirements.
14
NEW_BR1_FinalLayOut_Apr 02.qxd
4/29/02
12:41 AM
Page 15
Qualified projects are evaluated and selected based on eight criteria. Before TIFIA assistance can be committed, the project must receive an investment grade rating on its senior obligations and have a completed environmental action.
What are the benefits? TIFIA assistance provides improved access to capital markets, flexible repayment terms, and potentially more favorable interest rates than can be found in private capital markets for similar instruments. TIFIA can help advance expensive projects that otherwise might be delayed or deferred because of size, complexity, or uncertainty over the timing of revenues. The ability to use TIFIA to partner with the Federal government for essential and costly projects improves access to the capital markets. Large, complex projects frequently encounter market resistance as a result of investor concerns about risk, particularly in the case of subordinate and secondary sources of capital. However, with TIFIA, the government can be a flexible, patient investor by providing subordinate capital that may not be available through the capital markets on attractive terms. The flexibility provided by TIFIA can then enable the senior debt to demonstrate higher coverage margins and attain investment-grade bond ratings. By facilitating the borrower’s access to the capital markets through TIFIA, major projects that might be delayed or accomplished with less efficiency can be advanced.
How is it used? Approved TIFIA projects range in cost from a $242 million highway-rail corridor improvement project to a $3.3 billion dual span toll bridge structure. TIFIA assistance is also being provided to transit and ferry systems, as well as intermodal facilities. Four of the approved projects are toll facilities, including a new toll facility in central Texas that will span 122 miles and a new bridge in California to replace the east span of the San Francisco-Oakland Bay Bridge. For these projects, TIFIA credit assistance offers the project sponsors a way to boost debt service coverage and enhances senior obligations at an affordable cost. Also, flexible repayment terms will facilitate these toll financings, enabling a better match of loan repayments to expected revenue flows. Because of their size, many of the approved TIFIA projects were either unfunded in the near term or had large funding gaps. For some projects, TIFIA assistance enhanced market access and reduced borrowing costs; for others, it provided an alternative to grant funding, enabling the project sponsor to conserve regular Federal funds for smaller projects that could not be supported through user charges or dedicated revenue streams. 15
NEW_BR1_FinalLayOut_Apr 02.qxd
4/29/02
12:41 AM
Page 16
FOR MORE INFORMATION Additional innovative finance resources are available through these web sites: http://www.fhwa.dot.gov/innovativefinance TIFIA web site at http://tifia.fhwa.dot.gov/tifia/ National Cooperative Highway Research Program (NCHRP) web site at http://www.innovativefinance.org FHWA prepares the Innovative Finance Quarterly newsletter, available at the FHWA innovative finance web site above and as an insert to the AASHTO Journal, which provides up-to-date information on innovative finance programs, legislation and rules, and best practices.
FHWA INNOVATIVE FINANCE CONTACTS FHWA Headquarters Federal Aid Financial Management Division 400 7th Street, S.W., Room 4313 Washington, DC 20590 Tel: (202) 366-0673 TIFIA Joint Program Office 400 7th Street, S.W., Room 4301 Washington, DC 20590 Tel: (202) 366-5785
FHWA Southern Resource Center 61 Forsyth Street, S.W., Suite 17T26 Atlanta, GA 30303 Tel: (404) 562-3680 FHWA Midwestern Resource Center 19900 Governors Drive, Suite 301 Olympia Fields, IL 60461 Tel: (708) 283-3500 FHWA Western Resource Center 210 Mission Street, Suite 2100 San Francisco, CA 94105 Tel: (415) 744-3102
16
NEW_BR1_Final Cover_Apr 02.qxd
4/29/02
2:59 AM
Page 4
Publication Number - FHWA-AD-02-006
Related Documents

Tems Appendices
April 2020 3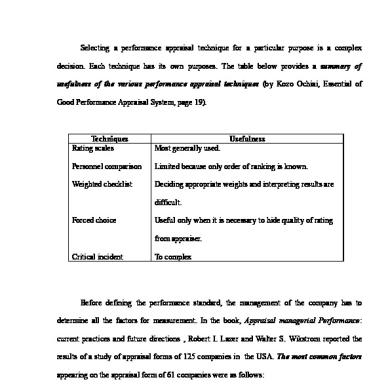
Appendices
November 2019 35
Appendices
June 2020 19
Appendices
June 2020 27
Appendices
October 2019 29