Pr With Dg2
This document was uploaded by user and they confirmed that they have the permission to share it. If you are author or own the copyright of this book, please report to us by using this DMCA report form. Report DMCA
Overview
Download & View Pr With Dg2 as PDF for free.
More details
- Words: 4,016
- Pages: 7
1
Investigation of Anti-Islanding Protection of Power Converter based Distributed Generators using Frequency Domain Analysis Vinod John, Member, IEEE, Zhihong Ye, Member, IEEE, Amol Kolwalkar
Abstract--Islanding of a grid connected Distributed Generation (DG) unit occurs when a section of the utility system containing such generators is disconnected from the main utility, but the independent DGs continue to energize the utility lines in the isolated section (termed as an island). Unintended islanding is a concern, primarily because it poses a hazard to utility and customer equipment, maintenance personnel and the general public. The algorithm proposed by the Sandia National Laboratories is analyzed in this study because it is considered to be effective in detecting the formation of such islands. Previously, there has not been any quantitative analysis for tuning the control gains of the algorithm based on the rating and bandwidth of the DG power converter. The paper interprets the components of the algorithm that affect the voltage magnitude and frequency into block diagrams that can be linearized and studied using continuous time approximations. The model represents DG operation while connected or disconnected from the main utility. This paper uses frequency domain approach to analyze the range for the gains required by anti-islanding algorithm to effectively determine the disconnection of the mains grid within an acceptable time duration. The effect of variation of DG’s operating power level is studied and demonstrated how the gains of the algorithm can be set to be effective for a wide power range. The results are validated using detailed time domain DG and power system simulations. Index Terms--Distributed generation, anti-islanding, inverters, Sandia voltage scheme, Sandia frequency scheme, power conditioning, power system protection, power system simulation, power system state estimation.
I. INTRODUCTION
I
slanding of a grid connected DG occurs when a section of the utility system containing such generators is disconnected from the main utility, but the independent DGs continue to energize the utility lines in the isolated section (termed as an island). Unintended islanding is a concern primarily because it poses a hazard to utility and customer equipment, maintenance personnel and the general public. Poor power quality can damage loads in the island. Another concern is the out of phase switching of the recloser
This work was supported by National Renewable Energy Laboratories (NREL) under award number NAD-1-30605-01. Vinod John is with Northern Power Systems, Waitsfield, VT 05602 USA (email: [email protected]). Zhihong Ye is with General Electric Global Research Center, Niskayuna, NY 12309 USA. (email: [email protected]) Amol Kolwalkar is with General Electric Global Research Center, Bangalore, India 560 066. (email: [email protected])
leading to damage to the DG, neighboring loads and utility equipment. Many techniques have been proposed to prevent islanding caused by DGs [1]-[9]. An algorithm proposed by the Sandia National Laboratories is analyzed in this study because it is considered to be effective in detecting the formation of such islands [1], [4]. Sandia’s active islanding algorithms had been developed for single-phase inverter units. The algorithm consists of the Sandia frequency shift (SFS) and the Sandia voltage shift (SVS) schemes. The principle behind both the methods is an accelerated frequency and voltage drift created with positive feedback. In the presence of the utility, the frequency and voltage shifts are not effective in drifting the two parameters. However, once the grid is disconnected, these methods force the frequency and/or voltage to shift outside the operating windows, causing the inverter to disconnect due to o/u voltage and frequency protection. Since these were originally developed for a single-phase inverter, the technique adopted to measure frequency is based on the zero crossing of the voltage waveform, and the voltage magnitude is obtained from RMS calculations. This method has been extended to three phase DGs that utilize three-phase continuous tracking Phase Locked Loop (PLL) in a synchronous reference frame [10]. II. ANALYSIS OF SANDIA ANTI-ISLANDING ALGORITHM Implementation of the Sandia anti-islanding algorithm is described in [1]. However, a systematic approach to tuning these algorithms has not been described in literature before. A block diagram interpretation of the Sandia’s algorithm is shown in Fig. 1. This block diagram model of the antiislanding algorithms is to determine the gain settings for the Sandia voltage scheme (SVS) and the Sandia frequency scheme (SFS) algorithms. The critical gains of the Sandia anti-islanding algorithm are: • Kf for the SFS • Kvp and Kv for SVS • ωf1 for the wash out functions • ωf2 for the power regulation loop The critical gains for SFS and SVS have to be determined for RLC loads (set according to IEEE P1547) so as to mitigate islanding situations [11]. The gain settings of the algorithm, shown in Fig. 1, have been obtained by performing a small
2
nr
|V|
1
dr
1 + s/ω f2 s/ω f1 1 + s/ω f1 s/ω f1 1 + s/ω f1
P*Kvp+Kv
Kf
P* ∆P + + ∆ω
P nr
Q* Iq*
%
I
Iq*2 + Id*2
dr
%
Id*
tan-1(Iq*/Id*)
Inverter
(V,θ v)
φ Rθ 2ω g
+
∆ θ*
GP
+
Grid/ Load (ω g)
θi
+
SA
Anti-islanding algorithm
(I,θ i)
^ θ
1/s ω^
ZCD PLL
θV
Fig. 1. The block diagram representation of the Sandia’s anti-islanding algorithm
signal analysis of the DG system with the tuned RLC load (according to IEEE 929 2 and IEEE P1547 anti-islanding test specifications) [11], [12]. The algorithm gains are determined by investigating the open loop behavior as a function of frequency. The voltage magnitude and the phase signal flow paths were opened so as to obtain the SVS and SFS gains, respectively. The Sandia voltage and frequency schemes and the derivation of the block diagram representations are explained in detail below. A. Sandia Frequency Shift (SFS) Algorithm The block diagram of the SFS algorithm is shown in Fig. 2. The frequency estimate from the PLL is passed through a washout function to determine changes in the ambient frequency. This information multiplied by the SFS gain, is added to the frequency reference of the current injected by the DG inverter. As the DG commanded frequency on average cannot be different from the grid frequency, the phase angle has to be periodically reset for meaningful power transfer from the DG to the rest of the grid system to occur. In the single-phase case, this reset of the phase angle in the DG current reference waveform occurs at the voltage zero crossings. In the SFS modification for a three-phase DG, the frequency of the system is determined using a continuous tracking PLL. This frequency estimate is then passed through a washout, to determine the trend in system frequency. The change in estimated system frequency is multiplied by the SFS gain constant (Kf) to obtain the increment or decrement in the output frequency of the DG inverter's current injection into the grid. In grid parallel mode (GP), the grid sets the frequency of operation of the DG. The Rθ/2ωg block in Fig. 2 is an equivalent representation of the actual DG system behavior that captures the change in the phase corresponding to the error in frequency. The derivation of this block in the GP is based on the equivalent phase angle change (φ) calculated in response to a change in frequency (∆ω) as a function of the
system frequency (ωg). This can be explained by considering the single-phase implementation where the frequency command from the SFS is higher than the nominal frequency and reset period of 180o, as shown in Fig. 3. ∆ωT ∆θ = , (1) 2π/Rθ where, T is the period and Rθ is the reset angle. Simplifying for the period in terms of ωg, we get ∆ω Rθ ∆θ = . (2) ωg The effective phase shift φ = ∆θ/2. For the situation of π radians for Rθ, the phase shift is given by ∆ω π , (3) φ= 2ωg at 60 Hz the relationship is φ = 4.1666e-3 ∆ω. In standalone mode (SA), the frequency of the island is set by the interaction of the DG and the load. Hence, in the SA mode, the phase angle error (∆θ*) caused by SFS is represented by the integral of the frequency error. This can be observed from the waveforms of the SFS algorithm shown in Fig. 3. This ∆θ* is then added to the reference phase angle, and the power factor angle reference, to provide the reference command for the phase angle of the current injected by the DG. The magnitude of the DG current is determined by the SVS loop, as explained below. Note that the SA mode considered in this analysis is during the transition of from grid parallel mode. In this condition the grid has been disconnected but the DG has not yet made any decision for mode transition and continues to inject current out of its terminals without consideration for instantaneous DG terminal voltage regulation. B. Sandia Voltage Shift (SVS) Algorithm The block diagram of the SVS algorithm is shown in Fig. 4. The input to this block is the magnitude of the system voltage. The error in the system voltage determines the shift in the reference power, to drive the DG voltage further away from the operating voltage range. The voltage magnitude, after a low pass filter, is also used to determine the
3 Power factor reference
s/ω f1 1 + s/ω f1
∆ω
Kf
Rθ 2ω g
φ +
∆θ*
GP
+
Phase angle for current injection
+
SA
SFS Anti-islanding algorithm
θi
^ θ
1/s ω^
ZCD PLL
θV
Fig. 2. Block diagram highlighting the SFS component of the Sandia’s anti-islanding algorithm.
sinω gt
SA mode
sin(ω + ∆ ω )t
∆θ φ
GP mode
θ 2π
Fig. 3. Nature of waveforms caused by the SFS algorithm.
magnitude of the reference current settings for the DG. This is to ensure that the desired level of real and reactive power is being delivered by the DG. As compared to the SFS, the gain in the feedback loop is not a constant, but is a function of the real power reference setting. The anti-islanding algorithm works by forcing the island with the DG to become unstable whenever the grid is disconnected. Hence, for the active anti-islanding to be effective, the open loop gain has to be greater than one. The next section interprets the characteristics of the SFS and SVS active anti-islanding algorithms based on frequency domain analysis. C. Implications of the Gains Settings of the Sandia AntiIslanding Algorithm The analysis of block diagram representation of the antiislanding algorithm can be used to evaluate the dependence of the gain settings of the SFS and SVS on various types of loads. The gains should be designed for the worst-case load for the schemes to be effective under all circumstances. The RLC load has a quality factor of 2.5 as defined in IEEE 929 [12] and UL 1741 [13] testing requirements. The SFS and SVS algorithms are analyzed separately assuming that they are decoupled with respect to each other. The voltage magnitude fed back into SVS is held at the nominal value
during the study of SFS algorithms. The frequency measurement into SFS is held at the nominal value (60 Hz) during the analysis of the SVS algorithm. Fig. 5 shows the open loop gain frequency response of the SFS algorithm with the RLC load at 50% and 100% power level for 3 different values of Kf. The plot shows the open loop gains obtained by breaking the θv signal flow path in Fig. 1. All gains referred to in the analysis are calculated in per unit on the DG base. It can be seen the response is nearly flat for low frequencies (10 Hz and below) and droops down at higher frequencies. Gains greater than 0 dB are inherently unstable because it results in positive feedback under closed loop conditions with phase angle approximately zero (not shown in the plot). It can be observed that the load power levels did not affect the loop gain of the SFS algorithm. This implies that the power level of DG operation does not affect the SFS. Similarly, Fig. 6 shows the open loop gain frequency response of SVS algorithm. As there are two gains to be set for the SVS, each gain (Kvp and Kv) is independently studied. In this case the loop gains are obtained by opening the |V| signal flow path shown in Fig. 1. The loop gain
4
Magnitude of output voltage
Q* nr
|V|
1 1 + s/ω f2
dr
%
P* Iq*2 +
dr
s/ω f1 1 + s/ω f1
P*Kvp+Kv
Iq*
∆P + +
P nr
%
Magnitude for current injection I Id*2
Id*
SVS Anti-islanding algorithm
Fig. 4. Block diagram highlighting the SVS component of the Sandia’s anti-islanding algorithm.
Fig. 5. Loop gain (in db) of the SFS algorithm with RLC load at 50% (lower subplot) and 100% (upper subplot) power level between 1Hz and 300Hz.
characteristics of the SVS algorithm is flat at low frequencies (below 5 Hz). The magnitude of the gain is higher than 0dB indicating that the SVS algorithm will be effective (i.e. unstable) for the gains shown in Fig. 6. Fig. 7 indicates additional characteristics of the SVS loop gain, as a function of the gain constants Kv and Kvp. It can be observed that the SVS loop gain characteristics have a tendency to reduce as power is increased. At low power operation (light loads), it can be observed that there is lower sensitivity of the SVS loop gain to variations in Kvp (keeping Kv = 1). It can be observed from Fig. 7 that at overloads the SVS loop has lower sensitivity to Kv (keeping Kvp = 1). In general it is observed for all loads, there is a cross over of the dominant gain from Kvp to Kv at the value of 1. Fig. 7 also indicates that as the loading on the DG increases, the loop gain has a decreasing trend. This means that the SVS algorithm tends to be less effective for higher loadings. This is because a portion of the SVS response is independent of the operating power level (Fig 4). At high loadings, the system is less sensitive; meaning the voltage change per Watt of DG output power change is less. Ideally, the gains should have remained constant (same detection time) even for any change in power output. Fig. 8(a) shows the effect of increasing Kvp at different load levels. The curves at different power levels tend to converge as the gain is increased. Fig. 8(b) shows the effect of increasing Kv at different load levels. The curves at different power levels tend to diverge as the gain is increased.
Fig. 6. Loop gain of the SVS algorithm for varying Kvp, with Kv = 1, for RLC loads.
Fig. 7. Variations of loop gain in dB at 2 Hz for varying load power level and gain constants of the SVS (keeping the other parameters fixed at 1.0).
Hence, an optimum tradeoff between Kv and Kvp has to be obtained that minimizes the sensitivity of SVS to load power level. The term Kvp, which multiplied by Power, tries to make it more insensitive to load power level when compared to using a single gain constant in the feedback path of the SVS. Figs. 8 (a) and (b) indicate that higher the gain the higher the instability causing faster detection of an islanding situation. However, setting the gains too high leads to greater harmonic distortion in the DG load current. Hence, a minimum acceptable gain has to be selected for both SFS and SVS. Besides, too strong positive feedback or too aggressive tripping may impose power systems stability issue when DG penetration is high [14].
5
(a)
(b)
Figure 8. Influence of load and gain constants on the SVS loop gain. (a) effect of Kvp gain (p.u.) on loop gain (dB) at various loads (%); (b) effect of Kv gain (p.u.) on loop gain (dB) at various loads (%).
shown in Fig. 4. In case the DG terminal voltage rises, the anti-islanding algorithm tries to increase the power command, while the power regulation loop through ωf2 lowers the reference current magnitude to maintain constant real and reactive power level. The corner frequency of ωf2 has been set to be decade lower than ωf1 in the anti-islanding algorithm, so that the change in current magnitude due to voltage regulation and anti-islanding do not counteract each other. The setting of 0.01 Hz corner frequency will also allow the DG prime mover to respond and change its power level in a time frame (of the order of 10 s) to a change in the measured output voltage. The range of values for the SFS and SVS gain determined from the above analysis provides design space for time domain simulations of the DG system. The time domain simulations are application dependent and need to be considered on an individual basis. The time domain simulations will provide acceptance trade-off for the time to detect island. Fig. 9. Single line diagram for testing the anti-islanding scenario.
The range of values for the SFS and SVS gain determined from the above analysis provides design space for time domain simulations of the DG system. D. Washout and Power Regulation Time Constants The schemes use a number of parameters (ωf1, ωf2, Kvp, Kv, Kf) that have to be set appropriately for the algorithm to operate properly. The corner frequency ωf1 is set to differentiate between a change in measured frequency or voltage due to variation in DG’s operating point and other slow dynamics of the power system. Hence, ωf1 is set to 0.1 Hz. Hence, voltage or frequency changes that occur in a time of less that 10s can excite the anti-islanding algorithm. If the voltage or frequency change sustains for longer than 10 s then it is considered a change in the nominal operating condition. The corner frequency ωf2 is set to 0.01 Hz. This is used to filter the measured voltage amplitude, which is then used to obtain the current command from the power command, as
III. TIME-DOMAIN VALIDATION The RLC resonant load as shown in Fig. 9 was first tested without any anti-islanding protection. The waveforms for this case are shown in Fig. 10. It can be observed from the voltage and current waveforms, that the DG continues to feed the RLC load and forms an island. The frequency and voltage drift by a small amount due to a minor difference in RLC values and due to the small numerical mismatch between the real and reactive power in the load and generator. However, the drifts in frequency and voltage magnitude are not sufficient to detect an islanding situation in an acceptable time frame (based on the passive anti-islanding limits on voltage and frequency set according to IEEE P1547). Fig. 11 depicts the voltage and current at the DG terminals for the RLC load, for the case where the active anti-islanding algorithm is enabled. The system was islanded at time 0.70037 s by disconnecting the grid. The DG detected the island and tripped due to a drift in the frequency because of the active anti-islanding algorithm.
6
(a)
The single-phase Sandia’s anti-islanding algorithm can be effectively adapted for three phase DG applications. In frequency domain it has been observed that the SFS loop gain did not vary with the load power, while SVS loop gain varies with power level. The algorithm when tuned for rated DG power level will be effective under all realistic operating conditions. The model presented in the paper will help the algorithms optimization. The approach can be extended to other antiislanding schemes. Future work will be preformed to study these algorithms with dynamic load, such as motors. V. REFERENCES [1]
[2]
[3] (b) Fig. 10. Waveforms for the RLC load without anti-islanding protection (a) load phase voltage, (b) current
[4] [5]
[6]
[7]
[8] (a)
[9]
[10]
[11] [12] [13] [14] (b) Figure 11. Waveforms for RLC load with Kf = 10 and Kv and Kvp = 2 (a) load phase voltage and (b) current.
J. Stevens, R. Bonn, J. Ginn, S. Gonzalez, and G. Kern, “Development and testing of an approach to anti-islanding in utility-interconnected photovoltaic systems,” Sandia Report SAND 2000-1939, August, 2000. http://www.sandia.gov/pv/0800steve.pdf. G.A. Smith, P.A. Onions, D.G. Infield, “Predicting islanding operation of grid connected PV inverters,” IEEE Proc. Electrical Power Applications., Vol 147, No. 1, Jan. 2000. S.-J. Huang and F.-S. Pai, “A new approach to islanding detection of dispersed generators with self-commuted static power converters,” IEEE Transactions on Power Delivery, vol. 15, no. 2, April 2000. Michael Eugene Ropp, “Design issues for grid-connected photovoltaic systems,” Ph.D. Dissertation, GeorgiaTech, October 12, 1998. P. O’Kane and B. Fox, “Loss of mains detection for embedded generation by system impedance monitoring,” In International Conference on Developments in Power System Protection, 25-27th March, 1997, pp. 9598. P.D. Hopewell, N. Jenkins and A.D. Cross, “Loss-of-mains detection for small generators,” IEE Proc.-Electr. Power Appl., vol. 143, no. 3, May 1996. A. Kitamura, M. Okamoto, F. Yamamoto, K. Nakaji, H. Matsuda, K. Otta, “Islanding phenomenon elimination study at Rokko Test Center,” 1st WCPEC, Hawaii, December 5-9, 1994. R. W. Wills, “Anti-islanding method and apparatus for distributed power generation,” US Patent no. 6,219,623. April 17, 2001. M. Eguchi, H. Kodama, T. Takebayashi and H. Nakata, “Inverter apparatus islanding operation detecting method and inverter apparatus capable of surely detecting and islanding operation with a simple construction,” US Patent no. 6,172,889. January 9, 2001. “DG Power Quality, Protection and Reliability Case Studies Report” Program: Reliable, Low Cost Distributed Generator/Utility System Interconnect, Contract No NAD-1-30605-01, National Renewable Energy Laboratory, September 28, 2001. IEEE P1547/D08 Draft Standard for Interconnecting Distributed Resources with Electric Power Systems, 2001. IEEE 929 – 2000, IEEE Recommended Practice for Utility Interface of Photovoltaic (PV) Systems, 2000. UL 1741, “Inverters, converters, and controllers for use in independent power systems. R. A. Walling, N. W. Miller, “Distributed Generation Islanding – Implications on Power System Dynamic Performance,” Proceedings of the IEEE/PES Summer Power Meeting, Chicago, July, 2002.
VI. BIOGRAPHIES IV. CONCLUSIONS This paper modeled and analyzed Sandia Frequency Shift (SFS) and Sandia Voltage Shift (SVS) anti-islanding schemes in frequency domain. The implications of the their gains with respective to effectiveness and power variation are discussed. Time domain simulation is provided to validate the gain settings. The DG without active anti-islanding has a tendency to island for a resonant RLC load, thus creating a number of possible hazardous conditions for the system.
Vinod John (S’92, M’99) received the B.Tech. degree in electrical engineering from the Indian Institute of Technology, Madras, India, in 1992 and the M.S.E.E. degree from the University of Minnesota, Minneapolis, in 1994, and the Ph.D. at the University of Wisconsin, Madison, in 1999. He was with General Electric Corporate Research and development between 1999 and 2002. Since June 2002, he has been with Northern Power Systems in Waitsfield, Vermont. His primary areas of interest are
7 power converters, wind turbine technology, microgrid systems and alternate energy. Zhihong Ye (S’98-M’00) received the B.S. and M.S. degrees in electrical engineering from Tsinghua University, Beijing, China, in 1992 and 1994, respectively, and the Ph.D. degree from the Virginia Polytechnic Institute and State University (Virginia Tech), Blacksburg, in 2000. Prior to joining Virginia Tech in 1996, he was a Research Assistant with the Department of Electrical and Applied Electronics Engineering, Tsinghua University. Since September 2000, Dr. Ye has been with General Electric Corporate Research and Development Center, where he is involved with several alternative energy and distributed generation programs, including power conditioning systems design for fuel cell and microturbine, distributed generation and grid interconnection studies, etc. His research interests are multi-phase power conversion, power conditioning systems for alternative energy, stability and interaction analysis of distributed power electronics systems. Amol Kolwalkar received the Bachelor degree in electrical engineering from SPCE, Mumbai, India, in 1997 and the MTech degree from the Indian Institute of Technology, Mumbai, India in 2001. He was employed with TCE from 1997 to 1999. Currently, he is working with General Electric, Global Research Centre. His areas of interest include analysis of distributed generation systems and power electronics application in power systems.
Related Documents

Pr With Dg2
November 2019 8
Dg2
May 2020 27
Pr With Dg 4
November 2019 6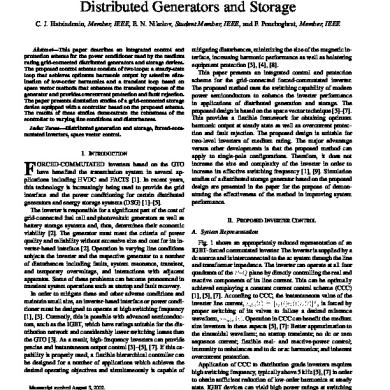
Pr With Dg 3
November 2019 7
Pr
November 2019 68