Marts Current
This document was uploaded by user and they confirmed that they have the permission to share it. If you are author or own the copyright of this book, please report to us by using this DMCA report form. Report DMCA
Overview
Download & View Marts Current as PDF for free.
More details
- Words: 2,915
- Pages: 4
FOR IMMEDIATE RELEASE MONDAY, NOVEMBER 16, 2009, AT 8:30 A.M. EST Timothy Winters / Ian Thomas Service Sector Statistics Division (301) 763-2713
CB09-166
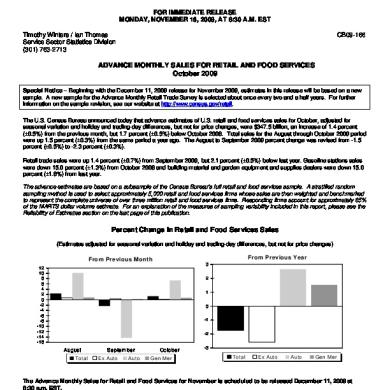
ADVANCE MONTHLY SALES FOR RETAIL AND FOOD SERVICES October 2009 Special Notice – Beginning with the December 11, 2009 release for November 2009, estimates in this release will be based on a new sample. A new sample for the Advance Monthly Retail Trade Survey is selected about once every two and a half years. For further information on the sample revision, see our website at http://www.census.gov/retail. The U.S. Census Bureau announced today that advance estimates of U.S. retail and food services sales for October, adjusted for seasonal variation and holiday and trading-day differences, but not for price changes, were $347.5 billion, an increase of 1.4 percent (±0.5%) from the previous month, but 1.7 percent (±0.5%) below October 2008. Total sales for the August through October 2009 period were up 1.5 percent (±0.3%) from the same period a year ago. The August to September 2009 percent change was revised from -1.5 percent (±0.5%) to -2.3 percent (±0.3%). Retail trade sales were up 1.4 percent (±0.7%) from September 2009, but 2.1 percent (±0.5%) below last year. Gasoline stations sales were down 15.0 percent (±1.3%) from October 2008 and building material and garden equipment and supplies dealers were down 15.0 percent (±1.8%) from last year. The advance estimates are based on a subsample of the Census Bureau’s full retail and food services sample. A stratified random sampling method is used to select approximately 5,000 retail and food services firms whose sales are then weighted and benchmarked to represent the complete universe of over three million retail and food services firms. Responding firms account for approximately 65% of the MARTS dollar volume estimate. For an explanation of the measures of sampling variability included in this report, please see the Reliability of Estimates section on the last page of this publication.
Percent Change in Retail and Food Services Sales (Estimates adjusted for seasonal variation and holiday and trading-day differences, but not for price changes) From Previous Year
From Previous M onth 3
12 10 8 6 4 2 0 -2 -4 -6 -8 -10 -12 -14 -16
2 1 0 -1 -2
August Total
September Ex Auto
Auto
October Gen Mer
-3
Total
Ex Auto
Auto
Gen Mer
The Advance Monthly Sales for Retail and Food Services for November is scheduled to be released December 11, 2009 at 8:30 a.m. EST. For information, visit the Census Bureau’s Web site at. This report is also available the day of issue through the Department of Commerce’s STAT-USA (202-482-1986). * The 90 percent confidence interval includes zero. The Census Bureau does not have sufficient statistical evidence to conclude that the actual change is different than zero.
Table 1. Estimated Monthly Sales for Retail and Food Services, by Kind of Business (Total sales estimates are shown in millions of dollars and are based on data from the Advance Monthly Retail Trade Survey, Monthly Retail Trade Survey, and administrative records.)
Adjusted2
Not Adjusted 1
NAICS
Kind of Business
code
Retail & food services, total ……………………………….
10 Month Total
2009
2009
2008
Oct.3 (a)
% Chg.
2008
2009
Sep. (p)
Aug. (r)
Oct.
Sep.
Oct.3 (a)
2008
Sep. (p)
Aug. (r)
Oct. (r)
Sep. (r)
3,384,719
-8.2
346,584
330,297
359,483
352,479
352,554 347,483
342,783
350,800
353,641
365,855
Total (excl. motor vehicle & parts) … 2,797,197
-6.6
289,286
276,082
290,828
296,500
291,226 288,468
287,809
286,661
296,142
303,757
Retail …..……………………………. 3,001,928 (*) GAFO4………………………....……...……...………….. Motor vehicle & parts dealers ……. 587,522 Auto & other motor veh. dealers . 522,275 New car dealers ………………. (*) Auto parts, acc. & tire stores…… (*)
-9.2 (*)
307,197 (*)
293,349 85,862
320,197 94,988
314,224 90,452
315,534 309,094 86,587 (*)
304,849 93,796
312,879 93,401
315,802 94,056
327,651 95,217
-14.9
57,298
54,215
68,655
55,979
61,328
59,015
54,974
64,139
57,499
62,098
-16.4
50,675
47,841
62,009
49,007
54,744
52,677
48,619
57,736
50,890
55,521
(*) (*)
(*) (*)
37,113 6,374
50,054 6,646
39,063 6,972
44,022 6,584
(NA) (NA)
(NA) (NA)
(NA) (NA)
(NA) (NA)
(NA) (NA)
76,476
-12.4
7,753
7,761
7,988
8,393
8,338
7,699
7,761
7,696
8,335
8,363
(*) (*)
(*) (*)
(*) (*)
4,288 3,473
4,401 3,587
4,359 4,034
4,459 3,879
(NA) (NA)
(NA) (NA)
(NA) (NA)
(NA) (NA)
(NA) (NA)
-9.5
7,406
7,558
8,131
7,988
8,226
8,343
8,394
8,316
8,969
9,143
(*) (*)
(*) (*)
5,882 1,676
6,428 1,703
6,218 1,770
6,522 1,704
(*) (*)
6,594 1,800
6,546 1,770
7,082 1,887
7,303 1,840
242,853
-12.6
23,069
23,208
23,415
27,676
26,895
22,557
23,116
23,249
26,540
26,726
(*)
(*)
(*)
20,349
20,261
23,912
23,445
(*)
19,417
19,389
22,348
22,435
Food & beverage stores……………. Grocery stores ………………….. Beer, wine & liquor stores ………
486,612
0.1
50,047
48,022
49,727
49,403
47,664
49,590
49,516
49,222
49,355
49,453
435,818 (*)
-0.3 (*)
44,681 (*)
42,921 3,368
44,417 3,524
44,164 3,516
42,741 3,303
44,282 (*)
44,203 3,487
43,890 3,500
44,120 3,512
44,245 3,488
Health & personal care stores ……. Pharmacies & drug stores ………
209,040
3.1
21,567
20,658
20,624
20,786
19,907
21,460
21,363
21,110
20,580
20,565
44611
(*)
(*)
(*)
17,225
17,062
17,392
16,567
(*)
17,739
17,553
17,118
17,062
447
Gasoline stations ……………………
297,419
-30.2
32,565
31,647
34,063
38,326
42,785
31,464
31,458
31,165
37,030
42,319
448
Clothing & clothing accessories stores …………………………….…..
161,903
-4.9
17,473
15,954
17,971
16,860
15,929
17,647
17,577
17,465
17,382
17,639
(*)
(*)
(*)
705
(*) (*) (*)
(*) (*) (*)
(*) (*) (*)
2,791 6,168 1,992
441 4411, 4412 44111
4413
Furniture & home furn. stores …… Furniture stores ………………….. Home furnishings stores ………..
442 4421 4422 443 44311, 13 44312
Electronics & appliance stores …… 78,602 Appl., T.V. & camera……………… (*) Computer & software stores……. (*) Building material & garden eq. & supplies dealers……………………. Building mat. & sup. dealers ……
444 4441 445 4451 4453 446
44811 44812 44814 4482
Men's clothing stores …………… Women's clothing stores ……….. Family clothing stores …………… Shoe stores ………………………
667
764
729
2,831 7,263 2,734
3,002 6,660 2,064
2,984 6,102 1,948
(*)
(S)
(S)
(S)
(S)
(*) (NA) (*)
2,904 (NA) 2,179
2,931 (NA) 2,198
2,990 (NA) 2,141
3,121 (NA) 2,143
451
Sporting goods, hobby, book & music stores…………………………
452
45299
General merchandise stores………. Department stores (ex. L.D.)…….. Department stores (incl. L.D.)5…… Other general merch. stores…. .. Warehouse clubs & supercenters…………………. All oth. gen. merch. stores……
453
Miscellaneous store retailers ……..
93,430
-4.2
10,011
9,457
9,423
9,984
9,686
9,615
9,525
9,512
9,746
9,743
454
232,435
-3.8
24,863
23,509
22,718
24,934
23,887
24,554
24,309
24,295
24,160
24,761
4541
Nonstore retailers ………………….. Elect. shopping & m/o houses ….
(*)
(*)
(*)
17,294
16,860
17,091
16,618
(*)
17,665
17,618
16,674
16,905
722
Food services & drinking places …
382,791
1.0
39,387
36,948
39,286
38,255
37,020
38,389
37,934
37,921
37,839
38,204
4521 4521 4529 45291
67,339
-1.4
6,374
6,888
8,296
6,190
6,710
7,202
7,289
7,303
7,010
7,169
468,297
-0.7
48,771
44,472
49,186
47,705
44,179
49,948
49,567
49,407
49,196
49,672
142,778
-6.7
15,060
13,539
15,441
15,487
13,958
15,602
15,557
15,584
16,070
16,286
(*)
(*)
(*)
13,889
15,840
15,972
14,407
(*)
(NA)
(NA)
(NA)
(NA)
(*)
(*)
(*)
30,933
33,745
32,218
30,221
(*)
34,010
33,823
33,126
33,386
(*) (*)
(*) (*)
(*) (*)
27,268 3,665
30,101 3,644
28,511 3,707
26,842 3,379
(*) (*)
30,031 3,979
29,892 3,931
29,393 3,733
29,627 3,759
(*) Advance estimates are not available for this kind of business. (NA) Not available
(S) Suppressed
(a) Advance estimate
(p) Preliminary estimate
(r) Revised estimate
(1) For a full description of the NAICS codes used in this table, see http://www.census.gov/eos/www/naics (2) Estimates are concurrently adjusted for seasonal variation and for holiday and trading day differences, but not for price changes. Concurrent seasonal adjustment uses all available unadjusted estimates as input to the X-12 ARIMA program. The factors derived from the program are used in calculating all seasonally adjusted estimates shown in this table. Year-to-date seasonally adjusted sales estimates are not tabulated. Adjustment factors and explanatory material can be found on the Internet at http://www.census.gov/retail (3) Advance estimates are based on early reports obtained from a small sample of firms selected from the larger Monthly Retail Trade Survey (MRTS) sample. All other estimates are from the MRTS sample (4) GAFO represents firms which specialize in department store types of merchandise and is comprised of furniture & home furnishings (442), electronics & appliances (443), clothing & accessories (448), sporting goods, hobby, book, and music (451), general merchandise (452), office supply, stationery, and gift stores (4532). (5) Estimates include data for leased departments operated within department stores. Data for this line are not included in broader kind-of-business totals. Note: Table 3 provides estimated measures of sampling variability. Additional information on confidentiality protection, sampling error, nonsampling error, sample design, and definitions may be found at http://www.census.gov/retail
Table 2. Estimated Change in Monthly Sales for Retail and Food Services, by Kind of Business (Estimates are shown as percents and are based on data from the Advance Monthly Retail Trade Survey, Monthly Retail Trade Survey, and administrative records.) Percent Change1
NAICS code
Kind of Business
Oct. 2009 Advance from --
Sep. 2009 Preliminary from --
Aug. 2009 through Oct. 2009 from -May 2009 Aug. 2008 through through Jul. 2009 Oct. 2008
Sep. 2009 (p)
Oct. 2008 (r)
Aug. 2009 (r)
Sep. 2008 (r)
Retail & food services, total ………………………………..
1.4
-1.7
-2.3
-6.3
1.5
-4.6
Total (excl. motor vehicle & parts) ….
0.2
-2.6
0.4
-5.3
1.1
-4.8
Retail ………………………..……….
1.4
-2.1
-2.6
-7.0
1.8
-5.1
4411, 4412
Motor vehicle & parts dealers ……… Auto & other motor veh. dealers …
7.4 8.3
2.6 3.5
-14.3 -15.8
-11.5 -12.4
3.8 4.5
-3.4 -3.4
442
Furniture & home furn. stores ………
-0.8
-7.6
0.8
-7.2
-0.9
-8.9
443
Electronics & appliance stores …….
-0.6
-7.0
0.9
-8.2
0.7
-8.7
444
Building material & garden eq. & supplies dealers………………………
-2.4
-15.0
-0.6
-13.5
-4.3
-14.3
4451
Food & beverage stores……………… Grocery stores …………………….
0.1 0.2
0.5 0.4
0.6 0.7
0.1 -0.1
0.8 0.8
-0.2 -0.4
446
Health & personal care stores ………
0.5
4.3
1.2
3.9
1.1
3.6
447
Gasoline stations …………………….
0.0
-15.0
0.9
-25.7
6.7
-22.8
448
Clothing & clothing accessories stores ……………………….…………
0.4
1.5
0.6
-0.4
2.2
-1.4
Sporting goods, hobby, book & music stores………………………….
-1.2
2.7
-0.2
1.7
1.5
1.1
4521
General merchandise stores………… Department stores (ex. L.D.)………
0.8 0.3
1.5 -2.9
0.3 -0.2
-0.2 -4.5
1.3 0.6
0.0 -4.5
453
Miscellaneous store retailers ………
0.9
-1.3
0.1
-2.2
1.2
-2.1
454
Nonstore retailers …………………….
1.0
1.6
0.1
-1.8
1.6
-0.9
722
Food services & drinking places …..
1.2
1.5
0.0
-0.7
-0.2
0.2
441
445
451
452
(p) Preliminary estimate
(r) Revised estimate
(1) Estimates shown in this table are derived from adjusted estimates provided in Table 1 of this report. Note: Table 3 provides estimated measures of sampling variability. Additional information on confidentiality protection, sampling error, nonsampling error, sample design, and definitions may be found at http://www.census.gov/retail.
Source: U.S. Census Bureau
Survey Description The U.S. Census Bureau conducts the Advance Monthly Retail Trade and Food Services Survey (MARTS) to provide an early estimate of monthly sales by kind of business for retail and food service firms located in the United States. Each month, questionnaires are mailed to a probability sample of approximately 5,000 employer firms selected from the larger Monthly Retail Trade Survey (MRTS). Firms responding to MARTS account for approximately 65% of the total national sales estimate. Advance sales estimates are computed using a link relative estimator. The change in sales from the previous month is estimated using only units that have reported data for both the current and
previous month. There is no imputation or adjustment for nonrespondents in MARTS. The total sales estimate is derived by multiplying this ratio by the preliminary sales estimate for the previous month (derived from the larger MRTS sample). Detailed industry estimates are summed to derive total estimates at broad industry levels. The monthly estimates are adjusted using annual survey estimates and for seasonal variation and holiday and trading-day differences. Additional information on MARTS and MRTS can be found on the Census Bureau website at: http://www.census.gov/retail.
FIRST-CLASS MAIL POSTAGE & FEES PAID
U.S. Department of Commerce U.S. Census Bureau Washington, D.C. 20233
Bureau of the Census PERMIT NO. G-58
Official Business Penalty for Private Use, $300
Reliability of Estimates Because the estimates presented in this report are based on a sample survey, they contain sampling error and nonsampling error. Sampling error is the difference between the estimate and the result that would be obtained from a complete enumeration of the sampling frame conducted under the same survey conditions. This error occurs because only a subset of the entire sampling frame is measured in a sample survey. Standard errors and coefficients of variation (CV), as given in Table 3 of this report, are estimated measures of sampling variation. The margin of sampling error, as used on page 1, gives a range about the estimate which is a 90 percent confidence interval. If, for example, the percent change estimate is +1.2 percent and its estimated standard error is 0.9 percent, then the margin of sampling error is ±1.65 x 0.9 percent or ±1.5 percent, and the 90 percent confidence interval is –0.3 percent to +2.7 percent. If the interval contains 0, then one does not have sufficient evidence to conclude at the 90 percent
Table 3.
confidence level that the change is different from zero and therefore the change is not statistically significant. Estimated changes shown in the text are statistically significant unless otherwise noted. For a monthly total, the median estimated coefficient of variation is given. The resulting confidence interval is the estimated value ±1.65 x CV x (the estimated monthly total). The Census Bureau recommends that individuals using estimates in this report incorporate this information into their analyses, as sampling error could affect the conclusions drawn from the estimates. Nonsampling error encompasses all other factors that contribute to the total error of a sample survey estimate. This type of error can occur because of nonresponse, insufficient coverage of the universe of retail businesses, mistakes in the recording and coding of data, and other errors of collection, response, coverage, or processing. Although nonsampling error is not measured directly, the Census Bureau employs quality control procedures throughout the process to minimize this type of error.
Estim ated M easures of Sam pling Variability and Revision to Advance Estim ates O ct 2009
(Estim ates are show n as percents and are based on data from the Advance M onthly Retail T rade Survey and M onthly R etail Trade Survey) M edian standard error (1) for Percent change
M edian
NAICS Code
441 4411, 4412
442 443 444 445 4451 446 447 448 451 452 4521
453 454 722
Kind of B usiness
Retail & food services, total … … … … … … ..… … … … … … … . T otal (excl. m otor vehicle & parts) .. Retail … ..… … … … … … … … … … .. M otor vehicle & parts dealers … … .. Auto & other m otor veh. dealers . Furniture & hom e furn. stores… … . Electronics & appliance stores … .. Building m aterial & garden eq. &… . supplies dealers… … … … … … … … Food & beverage stores… … … … … . G rocery stores … … … … … … … .. Health & personal care stores … … G asoline stations … … … … … … … .. Clothing & clothing accessories stores … … … … … … … … … … … … .. Sporting goods, hobby, book & m usic stores… … … … … … … … … .. G eneral m erchandise stores… … … . D epartm ent stores (ex. L.D .)… … M iscellaneous store retailers … … .. Nonstore retailers … … … … … … … .. Food services & drinking places ..
CV
(1)
for
Revision for m onthto-m onth change
(2)
Current M o.
Previous M o. to
Previous Qtr. to
Current M o. to sam e
Average
M edian absolute
(% )
Current M o.
Current Q tr.
M o. Last Yr.
revision
revision
0.7 0.7 0.7 2.3 2.6 2.9 1.4
0.3 0.3 0.4 1.6 1.8 1.9 0.6
0.2 0.2 0.2 0.8 0.9 0.9 0.5
0.3 0.3 0.3 1.5 1.6 2.0 1.0
-0.1 -0.1 -0.2 -0.3 -0.3 -0.1 0.2
0.2 0.2 0.1 1.2 1.3 0.6 1.1
2.6 1.0 1.0 1.9 2.4
1.3 0.2 0.2 0.3 0.7
0.9 0.3 0.3 0.4 0.5
1.1 0.5 0.5 0.9 0.8
-0.1 -0.1 -0.1 -0.1 -0.1
0.5 0.3 0.3 0.3 0.6
2.2
0.6
0.6
0.9
-0.3
0.6
2.8 0.1 0.0 4.5 1.9 2.0
1.3 0.0 0.0 3.7 1.0 0.8
1.2 0.0 0.0 1.7 0.5 0.6
1.7 0.1 0.0 3.6 1.0 1.3
0.0 -0.1 -0.2 0.7 0.0 0.3
0.5 0.2 0.4 0.8 0.3 0.6
(1)
Estimated measures of sampling variability are based on estimates not adjusted for seasonal variation or holiday or trading-day differences. Medians are based on estimates for the most recent 12 months.
(2)
These columns provide measures of the difference between the advance-to-preliminary and preliminary-to-final estimates of month-to-month change for the same pair of months as measured by the Advance sample and MRTS sample. The average and median revisions are based on estimates for the most recent 12 months. Note: Additional information on confidentiality protection, sampling error, nonsampling error, sample design, and definitions may be found at http://www.census.gov/retail
CB09-166
ADVANCE MONTHLY SALES FOR RETAIL AND FOOD SERVICES October 2009 Special Notice – Beginning with the December 11, 2009 release for November 2009, estimates in this release will be based on a new sample. A new sample for the Advance Monthly Retail Trade Survey is selected about once every two and a half years. For further information on the sample revision, see our website at http://www.census.gov/retail. The U.S. Census Bureau announced today that advance estimates of U.S. retail and food services sales for October, adjusted for seasonal variation and holiday and trading-day differences, but not for price changes, were $347.5 billion, an increase of 1.4 percent (±0.5%) from the previous month, but 1.7 percent (±0.5%) below October 2008. Total sales for the August through October 2009 period were up 1.5 percent (±0.3%) from the same period a year ago. The August to September 2009 percent change was revised from -1.5 percent (±0.5%) to -2.3 percent (±0.3%). Retail trade sales were up 1.4 percent (±0.7%) from September 2009, but 2.1 percent (±0.5%) below last year. Gasoline stations sales were down 15.0 percent (±1.3%) from October 2008 and building material and garden equipment and supplies dealers were down 15.0 percent (±1.8%) from last year. The advance estimates are based on a subsample of the Census Bureau’s full retail and food services sample. A stratified random sampling method is used to select approximately 5,000 retail and food services firms whose sales are then weighted and benchmarked to represent the complete universe of over three million retail and food services firms. Responding firms account for approximately 65% of the MARTS dollar volume estimate. For an explanation of the measures of sampling variability included in this report, please see the Reliability of Estimates section on the last page of this publication.
Percent Change in Retail and Food Services Sales (Estimates adjusted for seasonal variation and holiday and trading-day differences, but not for price changes) From Previous Year
From Previous M onth 3
12 10 8 6 4 2 0 -2 -4 -6 -8 -10 -12 -14 -16
2 1 0 -1 -2
August Total
September Ex Auto
Auto
October Gen Mer
-3
Total
Ex Auto
Auto
Gen Mer
The Advance Monthly Sales for Retail and Food Services for November is scheduled to be released December 11, 2009 at 8:30 a.m. EST. For information, visit the Census Bureau’s Web site at
Table 1. Estimated Monthly Sales for Retail and Food Services, by Kind of Business (Total sales estimates are shown in millions of dollars and are based on data from the Advance Monthly Retail Trade Survey, Monthly Retail Trade Survey, and administrative records.)
Adjusted2
Not Adjusted 1
NAICS
Kind of Business
code
Retail & food services, total ……………………………….
10 Month Total
2009
2009
2008
Oct.3 (a)
% Chg.
2008
2009
Sep. (p)
Aug. (r)
Oct.
Sep.
Oct.3 (a)
2008
Sep. (p)
Aug. (r)
Oct. (r)
Sep. (r)
3,384,719
-8.2
346,584
330,297
359,483
352,479
352,554 347,483
342,783
350,800
353,641
365,855
Total (excl. motor vehicle & parts) … 2,797,197
-6.6
289,286
276,082
290,828
296,500
291,226 288,468
287,809
286,661
296,142
303,757
Retail …..……………………………. 3,001,928 (*) GAFO4………………………....……...……...………….. Motor vehicle & parts dealers ……. 587,522 Auto & other motor veh. dealers . 522,275 New car dealers ………………. (*) Auto parts, acc. & tire stores…… (*)
-9.2 (*)
307,197 (*)
293,349 85,862
320,197 94,988
314,224 90,452
315,534 309,094 86,587 (*)
304,849 93,796
312,879 93,401
315,802 94,056
327,651 95,217
-14.9
57,298
54,215
68,655
55,979
61,328
59,015
54,974
64,139
57,499
62,098
-16.4
50,675
47,841
62,009
49,007
54,744
52,677
48,619
57,736
50,890
55,521
(*) (*)
(*) (*)
37,113 6,374
50,054 6,646
39,063 6,972
44,022 6,584
(NA) (NA)
(NA) (NA)
(NA) (NA)
(NA) (NA)
(NA) (NA)
76,476
-12.4
7,753
7,761
7,988
8,393
8,338
7,699
7,761
7,696
8,335
8,363
(*) (*)
(*) (*)
(*) (*)
4,288 3,473
4,401 3,587
4,359 4,034
4,459 3,879
(NA) (NA)
(NA) (NA)
(NA) (NA)
(NA) (NA)
(NA) (NA)
-9.5
7,406
7,558
8,131
7,988
8,226
8,343
8,394
8,316
8,969
9,143
(*) (*)
(*) (*)
5,882 1,676
6,428 1,703
6,218 1,770
6,522 1,704
(*) (*)
6,594 1,800
6,546 1,770
7,082 1,887
7,303 1,840
242,853
-12.6
23,069
23,208
23,415
27,676
26,895
22,557
23,116
23,249
26,540
26,726
(*)
(*)
(*)
20,349
20,261
23,912
23,445
(*)
19,417
19,389
22,348
22,435
Food & beverage stores……………. Grocery stores ………………….. Beer, wine & liquor stores ………
486,612
0.1
50,047
48,022
49,727
49,403
47,664
49,590
49,516
49,222
49,355
49,453
435,818 (*)
-0.3 (*)
44,681 (*)
42,921 3,368
44,417 3,524
44,164 3,516
42,741 3,303
44,282 (*)
44,203 3,487
43,890 3,500
44,120 3,512
44,245 3,488
Health & personal care stores ……. Pharmacies & drug stores ………
209,040
3.1
21,567
20,658
20,624
20,786
19,907
21,460
21,363
21,110
20,580
20,565
44611
(*)
(*)
(*)
17,225
17,062
17,392
16,567
(*)
17,739
17,553
17,118
17,062
447
Gasoline stations ……………………
297,419
-30.2
32,565
31,647
34,063
38,326
42,785
31,464
31,458
31,165
37,030
42,319
448
Clothing & clothing accessories stores …………………………….…..
161,903
-4.9
17,473
15,954
17,971
16,860
15,929
17,647
17,577
17,465
17,382
17,639
(*)
(*)
(*)
705
(*) (*) (*)
(*) (*) (*)
(*) (*) (*)
2,791 6,168 1,992
441 4411, 4412 44111
4413
Furniture & home furn. stores …… Furniture stores ………………….. Home furnishings stores ………..
442 4421 4422 443 44311, 13 44312
Electronics & appliance stores …… 78,602 Appl., T.V. & camera……………… (*) Computer & software stores……. (*) Building material & garden eq. & supplies dealers……………………. Building mat. & sup. dealers ……
444 4441 445 4451 4453 446
44811 44812 44814 4482
Men's clothing stores …………… Women's clothing stores ……….. Family clothing stores …………… Shoe stores ………………………
667
764
729
2,831 7,263 2,734
3,002 6,660 2,064
2,984 6,102 1,948
(*)
(S)
(S)
(S)
(S)
(*) (NA) (*)
2,904 (NA) 2,179
2,931 (NA) 2,198
2,990 (NA) 2,141
3,121 (NA) 2,143
451
Sporting goods, hobby, book & music stores…………………………
452
45299
General merchandise stores………. Department stores (ex. L.D.)…….. Department stores (incl. L.D.)5…… Other general merch. stores…. .. Warehouse clubs & supercenters…………………. All oth. gen. merch. stores……
453
Miscellaneous store retailers ……..
93,430
-4.2
10,011
9,457
9,423
9,984
9,686
9,615
9,525
9,512
9,746
9,743
454
232,435
-3.8
24,863
23,509
22,718
24,934
23,887
24,554
24,309
24,295
24,160
24,761
4541
Nonstore retailers ………………….. Elect. shopping & m/o houses ….
(*)
(*)
(*)
17,294
16,860
17,091
16,618
(*)
17,665
17,618
16,674
16,905
722
Food services & drinking places …
382,791
1.0
39,387
36,948
39,286
38,255
37,020
38,389
37,934
37,921
37,839
38,204
4521 4521 4529 45291
67,339
-1.4
6,374
6,888
8,296
6,190
6,710
7,202
7,289
7,303
7,010
7,169
468,297
-0.7
48,771
44,472
49,186
47,705
44,179
49,948
49,567
49,407
49,196
49,672
142,778
-6.7
15,060
13,539
15,441
15,487
13,958
15,602
15,557
15,584
16,070
16,286
(*)
(*)
(*)
13,889
15,840
15,972
14,407
(*)
(NA)
(NA)
(NA)
(NA)
(*)
(*)
(*)
30,933
33,745
32,218
30,221
(*)
34,010
33,823
33,126
33,386
(*) (*)
(*) (*)
(*) (*)
27,268 3,665
30,101 3,644
28,511 3,707
26,842 3,379
(*) (*)
30,031 3,979
29,892 3,931
29,393 3,733
29,627 3,759
(*) Advance estimates are not available for this kind of business. (NA) Not available
(S) Suppressed
(a) Advance estimate
(p) Preliminary estimate
(r) Revised estimate
(1) For a full description of the NAICS codes used in this table, see http://www.census.gov/eos/www/naics (2) Estimates are concurrently adjusted for seasonal variation and for holiday and trading day differences, but not for price changes. Concurrent seasonal adjustment uses all available unadjusted estimates as input to the X-12 ARIMA program. The factors derived from the program are used in calculating all seasonally adjusted estimates shown in this table. Year-to-date seasonally adjusted sales estimates are not tabulated. Adjustment factors and explanatory material can be found on the Internet at http://www.census.gov/retail (3) Advance estimates are based on early reports obtained from a small sample of firms selected from the larger Monthly Retail Trade Survey (MRTS) sample. All other estimates are from the MRTS sample (4) GAFO represents firms which specialize in department store types of merchandise and is comprised of furniture & home furnishings (442), electronics & appliances (443), clothing & accessories (448), sporting goods, hobby, book, and music (451), general merchandise (452), office supply, stationery, and gift stores (4532). (5) Estimates include data for leased departments operated within department stores. Data for this line are not included in broader kind-of-business totals. Note: Table 3 provides estimated measures of sampling variability. Additional information on confidentiality protection, sampling error, nonsampling error, sample design, and definitions may be found at http://www.census.gov/retail
Table 2. Estimated Change in Monthly Sales for Retail and Food Services, by Kind of Business (Estimates are shown as percents and are based on data from the Advance Monthly Retail Trade Survey, Monthly Retail Trade Survey, and administrative records.) Percent Change1
NAICS code
Kind of Business
Oct. 2009 Advance from --
Sep. 2009 Preliminary from --
Aug. 2009 through Oct. 2009 from -May 2009 Aug. 2008 through through Jul. 2009 Oct. 2008
Sep. 2009 (p)
Oct. 2008 (r)
Aug. 2009 (r)
Sep. 2008 (r)
Retail & food services, total ………………………………..
1.4
-1.7
-2.3
-6.3
1.5
-4.6
Total (excl. motor vehicle & parts) ….
0.2
-2.6
0.4
-5.3
1.1
-4.8
Retail ………………………..……….
1.4
-2.1
-2.6
-7.0
1.8
-5.1
4411, 4412
Motor vehicle & parts dealers ……… Auto & other motor veh. dealers …
7.4 8.3
2.6 3.5
-14.3 -15.8
-11.5 -12.4
3.8 4.5
-3.4 -3.4
442
Furniture & home furn. stores ………
-0.8
-7.6
0.8
-7.2
-0.9
-8.9
443
Electronics & appliance stores …….
-0.6
-7.0
0.9
-8.2
0.7
-8.7
444
Building material & garden eq. & supplies dealers………………………
-2.4
-15.0
-0.6
-13.5
-4.3
-14.3
4451
Food & beverage stores……………… Grocery stores …………………….
0.1 0.2
0.5 0.4
0.6 0.7
0.1 -0.1
0.8 0.8
-0.2 -0.4
446
Health & personal care stores ………
0.5
4.3
1.2
3.9
1.1
3.6
447
Gasoline stations …………………….
0.0
-15.0
0.9
-25.7
6.7
-22.8
448
Clothing & clothing accessories stores ……………………….…………
0.4
1.5
0.6
-0.4
2.2
-1.4
Sporting goods, hobby, book & music stores………………………….
-1.2
2.7
-0.2
1.7
1.5
1.1
4521
General merchandise stores………… Department stores (ex. L.D.)………
0.8 0.3
1.5 -2.9
0.3 -0.2
-0.2 -4.5
1.3 0.6
0.0 -4.5
453
Miscellaneous store retailers ………
0.9
-1.3
0.1
-2.2
1.2
-2.1
454
Nonstore retailers …………………….
1.0
1.6
0.1
-1.8
1.6
-0.9
722
Food services & drinking places …..
1.2
1.5
0.0
-0.7
-0.2
0.2
441
445
451
452
(p) Preliminary estimate
(r) Revised estimate
(1) Estimates shown in this table are derived from adjusted estimates provided in Table 1 of this report. Note: Table 3 provides estimated measures of sampling variability. Additional information on confidentiality protection, sampling error, nonsampling error, sample design, and definitions may be found at http://www.census.gov/retail.
Source: U.S. Census Bureau
Survey Description The U.S. Census Bureau conducts the Advance Monthly Retail Trade and Food Services Survey (MARTS) to provide an early estimate of monthly sales by kind of business for retail and food service firms located in the United States. Each month, questionnaires are mailed to a probability sample of approximately 5,000 employer firms selected from the larger Monthly Retail Trade Survey (MRTS). Firms responding to MARTS account for approximately 65% of the total national sales estimate. Advance sales estimates are computed using a link relative estimator. The change in sales from the previous month is estimated using only units that have reported data for both the current and
previous month. There is no imputation or adjustment for nonrespondents in MARTS. The total sales estimate is derived by multiplying this ratio by the preliminary sales estimate for the previous month (derived from the larger MRTS sample). Detailed industry estimates are summed to derive total estimates at broad industry levels. The monthly estimates are adjusted using annual survey estimates and for seasonal variation and holiday and trading-day differences. Additional information on MARTS and MRTS can be found on the Census Bureau website at: http://www.census.gov/retail.
FIRST-CLASS MAIL POSTAGE & FEES PAID
U.S. Department of Commerce U.S. Census Bureau Washington, D.C. 20233
Bureau of the Census PERMIT NO. G-58
Official Business Penalty for Private Use, $300
Reliability of Estimates Because the estimates presented in this report are based on a sample survey, they contain sampling error and nonsampling error. Sampling error is the difference between the estimate and the result that would be obtained from a complete enumeration of the sampling frame conducted under the same survey conditions. This error occurs because only a subset of the entire sampling frame is measured in a sample survey. Standard errors and coefficients of variation (CV), as given in Table 3 of this report, are estimated measures of sampling variation. The margin of sampling error, as used on page 1, gives a range about the estimate which is a 90 percent confidence interval. If, for example, the percent change estimate is +1.2 percent and its estimated standard error is 0.9 percent, then the margin of sampling error is ±1.65 x 0.9 percent or ±1.5 percent, and the 90 percent confidence interval is –0.3 percent to +2.7 percent. If the interval contains 0, then one does not have sufficient evidence to conclude at the 90 percent
Table 3.
confidence level that the change is different from zero and therefore the change is not statistically significant. Estimated changes shown in the text are statistically significant unless otherwise noted. For a monthly total, the median estimated coefficient of variation is given. The resulting confidence interval is the estimated value ±1.65 x CV x (the estimated monthly total). The Census Bureau recommends that individuals using estimates in this report incorporate this information into their analyses, as sampling error could affect the conclusions drawn from the estimates. Nonsampling error encompasses all other factors that contribute to the total error of a sample survey estimate. This type of error can occur because of nonresponse, insufficient coverage of the universe of retail businesses, mistakes in the recording and coding of data, and other errors of collection, response, coverage, or processing. Although nonsampling error is not measured directly, the Census Bureau employs quality control procedures throughout the process to minimize this type of error.
Estim ated M easures of Sam pling Variability and Revision to Advance Estim ates O ct 2009
(Estim ates are show n as percents and are based on data from the Advance M onthly Retail T rade Survey and M onthly R etail Trade Survey) M edian standard error (1) for Percent change
M edian
NAICS Code
441 4411, 4412
442 443 444 445 4451 446 447 448 451 452 4521
453 454 722
Kind of B usiness
Retail & food services, total … … … … … … ..… … … … … … … . T otal (excl. m otor vehicle & parts) .. Retail … ..… … … … … … … … … … .. M otor vehicle & parts dealers … … .. Auto & other m otor veh. dealers . Furniture & hom e furn. stores… … . Electronics & appliance stores … .. Building m aterial & garden eq. &… . supplies dealers… … … … … … … … Food & beverage stores… … … … … . G rocery stores … … … … … … … .. Health & personal care stores … … G asoline stations … … … … … … … .. Clothing & clothing accessories stores … … … … … … … … … … … … .. Sporting goods, hobby, book & m usic stores… … … … … … … … … .. G eneral m erchandise stores… … … . D epartm ent stores (ex. L.D .)… … M iscellaneous store retailers … … .. Nonstore retailers … … … … … … … .. Food services & drinking places ..
CV
(1)
for
Revision for m onthto-m onth change
(2)
Current M o.
Previous M o. to
Previous Qtr. to
Current M o. to sam e
Average
M edian absolute
(% )
Current M o.
Current Q tr.
M o. Last Yr.
revision
revision
0.7 0.7 0.7 2.3 2.6 2.9 1.4
0.3 0.3 0.4 1.6 1.8 1.9 0.6
0.2 0.2 0.2 0.8 0.9 0.9 0.5
0.3 0.3 0.3 1.5 1.6 2.0 1.0
-0.1 -0.1 -0.2 -0.3 -0.3 -0.1 0.2
0.2 0.2 0.1 1.2 1.3 0.6 1.1
2.6 1.0 1.0 1.9 2.4
1.3 0.2 0.2 0.3 0.7
0.9 0.3 0.3 0.4 0.5
1.1 0.5 0.5 0.9 0.8
-0.1 -0.1 -0.1 -0.1 -0.1
0.5 0.3 0.3 0.3 0.6
2.2
0.6
0.6
0.9
-0.3
0.6
2.8 0.1 0.0 4.5 1.9 2.0
1.3 0.0 0.0 3.7 1.0 0.8
1.2 0.0 0.0 1.7 0.5 0.6
1.7 0.1 0.0 3.6 1.0 1.3
0.0 -0.1 -0.2 0.7 0.0 0.3
0.5 0.2 0.4 0.8 0.3 0.6
(1)
Estimated measures of sampling variability are based on estimates not adjusted for seasonal variation or holiday or trading-day differences. Medians are based on estimates for the most recent 12 months.
(2)
These columns provide measures of the difference between the advance-to-preliminary and preliminary-to-final estimates of month-to-month change for the same pair of months as measured by the Advance sample and MRTS sample. The average and median revisions are based on estimates for the most recent 12 months. Note: Additional information on confidentiality protection, sampling error, nonsampling error, sample design, and definitions may be found at http://www.census.gov/retail
Related Documents
Marts Current
June 2020 1
Klubblad Marts
December 2019 2
Propositioner Klub Marts
November 2019 6
Current)
May 2020 33
Current
May 2020 24