Experiment5.docx
This document was uploaded by user and they confirmed that they have the permission to share it. If you are author or own the copyright of this book, please report to us by using this DMCA report form. Report DMCA
Overview
Download & View Experiment5.docx as PDF for free.
More details
- Words: 1,156
- Pages: 7
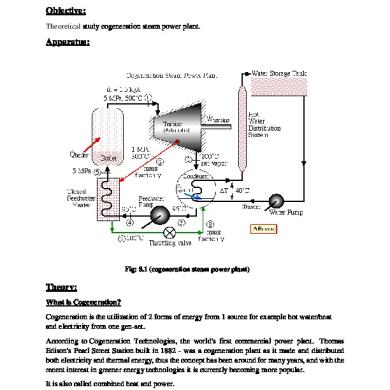
Experiment # 5: Objective: To find efficiency torque and power of impulse turbine using three stage reciprocatory compressor.
Apparatus: 1. 2. 3. 4. 5. 6.
External compressor setup for providing high pressure at the inlet. Tachometer to measure the speed (rpm) of the turbine. Strain gauge to measure the resistance given to the turbine. Thermocouples to measure the temperatures at inlet and exit conditions. Rotameter to measure the air mass flow rate Impulse Turbine
Fig: 5.1 (Impulse turbine)
Theory: Impulse Turbine: An impulse turbine is a turbine that is driven by high velocity jets of water or steam from a nozzle directed on to vanes or buckets attached to a wheel. The resulting impulse (as described by Newton's second law of motion) spins the turbine and removes kinetic energy from the fluid flow.
Tachometer: A tachometer is an instrument measuring the rotation speed of a shaft or disk, as in a motor or other machine. The device usually displays the revolutions per minute (RPM) on a calibrated analogue dial, but digital displays are increasingly common.
Degree of reaction: Is the ratio of static pressure drop in the rotor to the static pressure drop in the stage or as the ratio of static enthalpy drop in the rotor to the static enthalpy drop in the stage. In this setup, the flow is initiated by creating a large pressure difference between the inlet and the exit of the turbine. We can change the mass flow rate by changing the inlet pressure. The four nozzles are used to convert most of the flow energy to kinetic energy. With this kinetic energy, the flow impinges on the turbine blades which initiates and maintains the rotation of the turbine.
Strain Gauge: A strain gauge is attached to the belt the turbine to measure the force to the resistance created during various operating conditions. This setup measures the strain which is converted to force in Newton by the setup. The nozzles are positioned such that they produce couple to rotate the turbine. In his setup, four nozzles are positioned as shown in the figure. They provide two couples to drive he turbine. The nozzle is also provided with valves so that they can be closed or opened to change the inlet flow which facilitates the study of the turbine at different conditions.
Torque: Torque is a twisting or turning force that tends to cause rotation around an axis, which might be a center of mass or a fixed point.
Power: Power is the rate at which work is done or the rate at which energy is transferred from one place to another or transformed from one type to another.
P = Fv cos θ
P=F·v
Procedure: 1. There are two steps followed in this experiment 2. In the first step, the inlet is provided with different pressures and hence different mass flows. As we vary the pressure, the mass flow will vary and the rpm of the turbine will vary accordingly. The rpm will be controlled by varying the resistance and it will be set at particular constant value for different pressures. The resistance to the load will be measured using a strain gauge while the mass flow rate will be taken from a tachometer.
3. In the second step, the inlet pressure is kept constant and the rpm is varied by varying the resistance load. This gives the value of resistance force at different rpm. The mass flow rate remains constant as the pressure different is maintained constant. 4. Both of the above steps are repeated with two adjacent nozzles shut off and the readings are recorded for calculation of performance parameters.
Formulae used: 1. Pideal = mCp ΔT = mCp(T1-Tideal) 2. Pactual = (2.Phi.NT)/60
Here T is torque.
3.
Efficiency η =Pactual/Pideal
4. Specific Air consumption SAC = m/Pactual
Observation Tables: For case 1: 4 nozzle open: P1
P2
Kpa
Actual RPM
Load
Mass flow rate
T1
T2
Kpa
N
Kg/sec
K
K
131.325
101.325 21480
0.66
0.0029
298.7
295.2
141.325
101.325 21490
0.96
0.0033
298.7
293.9
151.325
101.325 21450
1.16
0.0037
298.8
293
Ref. Pres. = 50KPa RPM
Actual RPM
Load
Mass flow rate
T1
T2
N
Kg/sec
K
K
18500
18400
1.41
0.0037
298.9
294.4
20500
20590
1.23
0.0037
298.9
293
22500
22410
1.14
0.0037
298.9
293.1
Case 2: 2 nozzle open:
Reference RPM=19500 P1
P2
Kpa
Kpa
131.325
101.325
141.325
101.325
Actual RPM Load
Mass flow rate
T1
T2
N
Kg/sec
K
K
19400
0.38
0.0008
299.7
296.5
19500
0.56
0.001
299.6
296
Ref. Pres. = 50KPa RPM
Actual RPM
Load
Mass flow rate
T1
T2
N
Kg/sec
K
K
16500
16580
0.77
0.0015
299.6
294.4
17500
17490
0.6
0.0015
299.6
294.4
2 nozzles open Inlet Pressure Constant: Reference RPM=19500
Rp
T
T2 Ideal
SAC
N-m
W
W
K
%
Kg/KW-Hr
0.66958533
0.011165
19.37544
48.90271
267.1604
39.62039
278.7033
0.66958533
0.0087
15.92639
48.90271
267.1604
32.56751
339.0598
2 nozzles open RPM Constant:
Reference RPM=19500
Rp
T
T2 Ideal
SAC
N-m
W
W
K
%
Kg/KW-Hr
0.771559109
0.00551
11.18824
17.20905
278.2957
65.0137
257.4131716
0.716964444
0.00812
16.57292
27.30554
272.4303
60.69434
217.2218293
Graph: For each case: 2 nozzle open and 4 nozzle open (𝟐 × 𝟖 = 𝟏𝟔) Efficiency – RPM (Inlet pressure constant):
Torque-Pressure Ratio (Rpm Constant):
Precautions: 1. All the nozzles should not be set to close at the same time. 2. We need to decrease the resistance before reducing the pressure difference. 3. The pressure supply should not be more than 50KPa so that the chances of instabilities due to vibration at high speeds (rpm) are reduced.
Conclusion: The efficiency drops for both 4 nozzle open (Case 1) and 2 nozzle open (Case 2) with increase in RPM. This is because of the higher rate of increase of ideal power than the actual power with increase in RPM. So more the RPM, less efficient is the turbine as the thermal losses become more pronounced at higher speeds. In the case with pressure ratio, efficiency increases directly with it as turbine efficiency depends much on its pressure ratio. We get more efficiency for 2 nozzle case as for the same pressure ratio as the RPM of this case is lesser for the same pressure ratio. It is obvious that torque vs. RPM curve shows a negative trend because torque always decreases with RPM. The main reason for this trend is that the performance of the engine in terms of power, torque, efficiency etc. decreases as the turbine is unable to convert the energy efficiently as the losses such as thermal, vibrational and stress related losses begins to increase. The actual power first decreases and then changes the trend with RPM. For both cases (Case 1 and case2) the actual power decreases with pressure ratio because of the losses discussed above. SAC shows a variation which first decreases with power and then mildly increases as at the optimum value of power, the SAC becomes the least and beyond that, SAC increases.
More Documents from "Akram"
Experiment8.pdf
December 2019 26
2123.docx
December 2019 33
List Of Experiments Mom 1.docx
December 2019 13
Experiment5.docx
December 2019 13
