Zobgy Internals
This document was uploaded by user and they confirmed that they have the permission to share it. If you are author or own the copyright of this book, please report to us by using this DMCA report form. Report DMCA
Overview
Download & View Zobgy Internals as PDF for free.
More details
- Words: 5,225
- Pages: 18
Poll of Houston Likely Voters - 12/2/09 thru 12/4/09 MOE +/- 4.1 Percentage Points
4. Who will you vote for in the runoff election for mayor on December 12-- Gene Locke or Annise Parker? Gender Male
Total ƒ
%
ƒ
%
Female ƒ
18-24
%
ƒ
%
ƒ
Locke
218
36.4
112
38.9
106
34.1
Parker
251
41.9
110
38.2
141
45.3
8
49.6
Someone else
25
4.1
15
5.2
9
3.0
6
36.2
NS
106
17.6
51
17.7
55
17.6
2
14.3
Total
600 100.0
289 100.0
311 100.0
AgeGroup-B 35-54
25-34 %
%
ƒ
70+ %
ƒ
White %
ƒ
%
ƒ
%
ƒ
Democratic ƒ %
%
ƒ
Asian
%
ƒ
Other %
ƒ
%
42.7
96
37.4
57
37.8
28
34.8
79
25.9
20
22.9
97
61.2
7
40.2
6
36.6
35
49.6
100
39.0
62
41.1
34
42.4
161
52.7
42
47.5
32
20.3
9
50.6
5
28.0
13
5.0
3
2.0
3
3.7
15
4.9
8
9.5
1
.8
48
18.6
29
19.1
15
19.1
51
16.6
18
20.2
28
17.7
2
9.2
6
35.4
7.7
71 100.0
256 100.0
150 100.0
81 100.0
306 100.0
88 100.0
Party Total
Race AfrAmer
Hisp
30
5
16 100.0
ƒ
55-69
159 100.0
18 100.0
18 100.0
AgeGroup Republican ƒ %
Independent ƒ %
18-29 ƒ
30-49 %
ƒ
50-64 %
ƒ
65+ %
ƒ
%
Locke
218
36.4
113
43.2
75
35.4
30
24.1
21
36.6
82
34.1
69
42.9
39
33.9
Parker
251
41.9
110
42.2
79
37.1
62
49.3
28
49.3
101
42.1
59
36.5
51
44.0
Someone else
25
4.1
1
.5
19
8.9
4
3.5
6
10.1
11
4.5
4
2.5
4
3.4
NS
106
17.6
37
14.2
40
18.6
29
23.1
2
4.0
47
19.4
29
18.0
21
18.7
Total
600
100.0
261
100.0
213
100.0
126
100.0
57
100.0
241
100.0
161
100.0
115
100.0
Zogby International
1
12/4/2009
Poll of Houston Likely Voters - 12/2/09 thru 12/4/09 MOE +/- 4.1 Percentage Points
4. Who will you vote for in the runoff election for mayor on December 12-- Gene Locke or Annise Parker? Total Total ƒ
Education No College College Degree Degree+ ƒ % ƒ %
Total %
ƒ
%
Income < $25K ƒ
$25-35K ƒ %
%
$35-50K ƒ %
$50-75K ƒ %
$75-100K ƒ %
$100+ ƒ
%
Locke
218
36.4
218
36.4
100
40.5
118
33.6
33
52.1
28
43.4
28
40.7
20
22.8
27
33.2
54
37.6
Parker
251
41.9
251
41.9
86
34.8
165
46.8
15
24.0
30
46.7
25
37.0
38
43.1
42
52.4
71
49.7
Someone else
25
4.1
25
4.1
17
6.9
8
2.2
2
2.8
3
4.0
0
.5
5
5.4
1
.7
1
.9
NS
106
17.6
106
17.6
44
17.8
61
17.4
13
21.2
4
5.8
15
21.8
25
28.7
11
13.8
17
11.8
Total
600
100.0
600
100.0
246
100.0
351
100.0
63
100.0
64
100.0
69
100.0
87
100.0
81
100.0
144
100.0
Zogby International
2
12/4/2009
Poll of Houston Likely Voters - 12/2/09 thru 12/4/09 MOE +/- 4.1 Percentage Points
5. Who will you vote for in the runoff election for city controller on December 12--Ronald Green or M.J. Khan? Gender Male
Total ƒ
%
ƒ
%
Female ƒ
18-24
%
ƒ
AgeGroup-B 35-54
25-34 %
ƒ
%
ƒ
55-69
%
ƒ
70+ %
ƒ
White %
ƒ
Race AfrAmer
Hisp %
ƒ
%
ƒ
Asian
%
ƒ
Other %
ƒ
%
Green
177
29.5
80
27.7
97
31.1
6
36.2
28
39.7
78
30.3
39
25.8
23
27.8
57
18.7
39
43.8
69
43.5
1
5.7
8
45.2
Khan
212
35.4
130
44.9
82
26.5
8
49.6
26
36.1
85
33.1
60
40.1
23
28.8
134
43.8
22
24.7
36
22.8
12
67.6
2
10.5
4
1.2
3
1.0
1
1.3
4
1.2
128
41.2
91
35.6
34
42.1
111
36.3
28
31.5
54
33.7
5
26.7
8
44.3
Someone else
4
.6
NS
207
34.5
Total
600 100.0
79
27.4
289 100.0
2
311 100.0
14.3
17
16 100.0
24.2
71 100.0
51
256 100.0
34.1
150 100.0
81 100.0
306 100.0
88 100.0
Party Total ƒ
Democratic ƒ %
%
159 100.0
18 100.0
18 100.0
AgeGroup Republican ƒ %
Independent ƒ %
18-29 ƒ
30-49 %
ƒ
50-64 %
ƒ
65+ %
ƒ
%
Green
177
29.5
119
45.4
24
11.4
34
27.0
17
29.5
76
31.4
50
31.1
30
26.4
Khan
212
35.4
61
23.4
113
53.3
38
30.1
31
53.9
73
30.3
57
35.4
41
35.6
4
1.7
3
1.1
1
.9
Someone else
4
.6
NS
207
34.5
82
31.2
72
33.6
54
42.9
10
16.6
90
37.3
54
33.5
42
37.0
Total
600
100.0
261
100.0
213
100.0
126
100.0
57
100.0
241
100.0
161
100.0
115
100.0
Zogby International
3
12/4/2009
Poll of Houston Likely Voters - 12/2/09 thru 12/4/09 MOE +/- 4.1 Percentage Points
5. Who will you vote for in the runoff election for city controller on December 12--Ronald Green or M.J. Khan? Total Total ƒ
Education No College College Degree Degree+ ƒ % ƒ %
Total %
ƒ
%
Income < $25K ƒ
%
$25-35K ƒ %
$35-50K ƒ %
$50-75K ƒ %
$75-100K ƒ %
$100+ ƒ
%
Green
177
29.5
177
29.5
74
30.1
101
28.9
14
21.9
16
24.8
26
37.4
30
33.9
26
32.3
39
27.0
Khan
212
35.4
212
35.4
82
33.1
130
37.1
19
30.3
30
47.7
23
32.7
29
32.8
33
41.5
46
32.4
3
2.2
Someone else
4
.6
4
.6
3
1.3
1
.2
NS
207
34.5
207
34.5
87
35.5
119
33.9
30
47.8
18
27.5
21
29.9
29
33.3
21
26.2
55
38.4
Total
600
100.0
600
100.0
246
100.0
351
100.0
63
100.0
64
100.0
69
100.0
87
100.0
81
100.0
144
100.0
Zogby International
4
12/4/2009
Poll of Houston Likely Voters - 12/2/09 thru 12/4/09 MOE +/- 4.1 Percentage Points
6. Favorability - Gene Locke Gender Male
Total ƒ
%
ƒ
%
Female ƒ
18-24
%
ƒ
V fav
130
21.6
60
20.6
70
22.5
Smw fav
214
35.7
104
36.0
110
35.3
Smw unfav
87
14.5
36
12.3
52
V unfav
69
11.4
47
16.1
Not familiar
92
15.4
39
13.5
8
1.4
4
1.5
NS Total
600 100.0
289 100.0
AgeGroup-B 35-54
25-34 %
ƒ
%
ƒ
55-69
%
ƒ
70+ %
ƒ
White %
ƒ
%
ƒ
%
ƒ
Asian
%
ƒ
Other %
ƒ
%
21.4
55
21.3
36
24.0
19
23.0
30
9.7
16
17.9
75
47.1
4
22.7
3
18.4
28
39.7
95
37.1
47
31.3
25
30.9
116
38.0
25
27.9
50
31.1
11
62.4
4
24.1
16.6
5
6.9
37
14.5
25
16.4
16
19.5
70
22.9
8
9.0
4
2.8
5
26.2
22
7.1
17
23.9
25
9.9
15
10.0
8
10.2
45
14.6
14
15.9
6
4.1
3
15.3
53
17.1
6
8.2
43
16.9
23
15.6
12
14.7
40
13.1
26
29.2
21
13.3
2
13.1
4
1.3
1
.3
4
2.7
1
1.7
5
1.7
3
1.6
0
2.8
6
311 100.0
63.8
36.2
16 100.0
Democratic ƒ %
%
ƒ
15 10
71 100.0
256 100.0
150 100.0
81 100.0
306 100.0
88 100.0
Party Total
Race AfrAmer
Hisp
3
159 100.0
15.0
18 100.0
18 100.0
AgeGroup Republican ƒ %
Independent ƒ %
18-29 ƒ
30-49 %
ƒ
50-64 %
ƒ
65+ %
ƒ
%
V fav
130
21.6
87
33.1
23
10.6
20
16.2
9
15.8
48
19.8
42
26.4
25
21.9
Smw fav
214
35.7
105
40.2
67
31.5
42
33.3
24
41.5
91
37.7
55
34.0
36
31.3
Smw unfav
87
14.5
22
8.5
46
21.5
19
15.3
4
6.4
32
13.4
26
16.1
20
17.7
V unfav
69
11.4
17
6.4
35
16.6
16
13.1
15
26.2
22
9.1
16
9.7
13
11.5
Not familiar
92
15.4
30
11.5
38
17.9
24
19.1
6
10.1
48
19.9
18
11.0
19
16.3
8
1.4
1
.2
4
1.9
4
2.9
4
2.7
2
1.4
600
100.0
261
100.0
213
100.0
126
100.0
161
100.0
115
100.0
NS Total
Zogby International
5
57
100.0
241
12/4/2009
100.0
Poll of Houston Likely Voters - 12/2/09 thru 12/4/09 MOE +/- 4.1 Percentage Points
6. Favorability - Gene Locke Total Total ƒ
Education No College College Degree Degree+ ƒ % ƒ %
Total %
ƒ
%
Income < $25K ƒ
$25-35K ƒ %
%
$35-50K ƒ %
$50-75K ƒ %
$75-100K ƒ %
$100+ ƒ
%
V fav
130
21.6
130
21.6
60
24.5
68
19.5
19
30.8
14
22.7
24
35.2
16
18.5
11
13.2
23
16.2
Smw fav
214
35.7
214
35.7
84
34.0
130
36.9
21
34.0
27
41.7
23
33.2
23
26.2
31
38.8
65
45.5
Smw unfav
87
14.5
87
14.5
29
11.8
58
16.5
3
4.4
6
10.1
7
10.2
6
6.9
16
20.3
33
22.7
V unfav
69
11.4
69
11.4
25
10.0
44
12.5
4
6.8
7
11.4
7
10.1
17
19.8
12
15.2
12
8.2
Not familiar
92
15.4
92
15.4
48
19.6
43
12.2
14
21.7
9
14.2
7
10.8
23
25.9
8
9.9
10
6.7
8
1.4
8
1.4
0
.1
8
2.3
1
2.3
0
.4
2
2.6
2
2.5
1
.8
600
100.0
600
100.0
246
100.0
351
100.0
63
100.0
69
100.0
87
100.0
81
100.0
144
100.0
NS Total
Zogby International
6
64
100.0
12/4/2009
Poll of Houston Likely Voters - 12/2/09 thru 12/4/09 MOE +/- 4.1 Percentage Points
7. Favorability - Annise Parker Gender Male
Total ƒ
%
ƒ
%
Female ƒ
18-24
%
ƒ
AgeGroup-B 35-54
25-34 %
ƒ
%
ƒ
55-69
%
ƒ
70+ %
ƒ
White %
ƒ
Race AfrAmer
Hisp %
ƒ
%
ƒ
Asian
%
ƒ
Other %
ƒ
%
V fav
189
31.5
76
26.2
114
36.6
22
30.9
90
35.2
44
29.3
26
32.0
99
32.3
42
47.1
42
26.6
1
5.7
4
24.4
Smw fav
211
35.2
109
37.8
102
32.8
8
49.6
27
38.5
87
34.0
56
37.0
26
31.6
116
37.9
20
22.1
63
39.4
8
44.9
3
14.5
Smw unfav
75
12.4
38
13.2
36
11.7
2
14.3
11
15.2
32
12.6
16
10.9
10
12.2
32
10.6
9
9.8
21
13.3
5
29.9
V unfav
48
8.0
24
8.4
24
7.7
4
5.1
18
7.0
15
10.3
8
9.6
34
11.0
4
4.8
7
4.5
3
14.9
Not familiar
66
10.9
38
13.3
27
8.7
7
10.3
25
9.8
16
10.6
11
13.3
19
6.1
14
16.3
21
13.3
3
14.9
11
1.9
3
1.2
8
2.6
4
1.5
3
1.9
1
1.3
7
2.1
5
2.9
0
1.4
NS Total
600 100.0
289 100.0
6
311 100.0
36.2
16 100.0
71 100.0
256 100.0
150 100.0
81 100.0
306 100.0
88 100.0
Party Total ƒ
Democratic ƒ %
%
9
159 100.0
49.4
18 100.0
18 100.0
AgeGroup Republican ƒ %
Independent ƒ %
18-29 ƒ
30-49 %
ƒ
50-64 %
ƒ
65+ %
ƒ
%
V fav
189
31.5
108
41.3
40
18.8
41
32.8
7
12.7
94
39.0
44
27.2
37
32.2
Smw fav
211
35.2
86
33.1
77
36.2
48
37.8
30
52.6
79
32.9
57
35.6
37
31.8
Smw unfav
75
12.4
31
11.9
37
17.5
6
5.1
11
18.4
25
10.2
23
14.0
14
12.0
V unfav
48
8.0
11
4.2
27
12.7
10
8.0
4
6.3
12
5.0
18
11.1
11
9.8
Not familiar
66
10.9
22
8.3
26
12.1
18
14.4
6
10.1
28
11.8
16
9.7
15
13.1
NS
11
1.9
3
1.2
6
2.7
2
1.9
3
1.1
4
2.4
1
1.1
600
100.0
261
100.0
213
100.0
126
100.0
241
100.0
161
100.0
115
100.0
Total
Zogby International
7
57
100.0
12/4/2009
Poll of Houston Likely Voters - 12/2/09 thru 12/4/09 MOE +/- 4.1 Percentage Points
7. Favorability - Annise Parker Total Total ƒ
Education No College College Degree Degree+ ƒ % ƒ %
Total %
ƒ
%
Income < $25K ƒ
$25-35K ƒ %
%
$35-50K ƒ %
$50-75K ƒ %
$75-100K ƒ %
$100+ ƒ
%
V fav
189
31.5
189
31.5
81
33.0
106
30.2
13
21.3
20
31.2
27
38.6
29
33.4
28
34.7
49
34.4
Smw fav
211
35.2
211
35.2
73
29.4
139
39.5
21
33.1
23
36.7
20
29.5
24
27.9
38
46.6
55
38.3
Smw unfav
75
12.4
75
12.4
39
15.8
36
10.1
10
15.6
1
2.1
11
16.3
14
16.2
8
9.7
21
14.7
V unfav
48
8.0
48
8.0
9
3.8
38
10.9
6
9.0
8
11.8
7
10.2
6
6.8
3
4.3
10
6.8
Not familiar
66
10.9
66
10.9
39
15.9
26
7.5
10
15.8
12
18.1
3
5.0
11
13.2
3
3.2
8
5.3
NS
11
1.9
11
1.9
5
2.0
6
1.8
3
5.2
0
.4
2
2.6
1
1.5
1
.6
600
100.0
600
100.0
246
100.0
351
100.0
63
100.0
69
100.0
87
100.0
81
100.0
144
100.0
Total
Zogby International
8
64
100.0
12/4/2009
Poll of Houston Likely Voters - 12/2/09 thru 12/4/09 MOE +/- 4.1 Percentage Points
8. Is Annise Parker's sexual orientation a factor you will consider in determining which candidate is best fit for mayor? Gender Total ƒ %
AgeGroup-B
Male ƒ
Female ƒ %
%
18-24 ƒ %
Yes
109
18.1
50
17.4
58
18.8
No
459
76.5
220
76.2
239
76.7
NS
32
5.4
19
6.4
14
4.5
Total
600 100.0
289 100.0
16 100.0
311 100.0
16 100.0
25-34 ƒ %
Race
35-54 ƒ %
55-69 ƒ %
70+ ƒ
White ƒ %
%
Hisp ƒ
ƒ
Democratic ƒ %
%
%
Asian ƒ
Other ƒ %
%
4
5.0
47
18.3
34
22.4
20
25.2
49
16.1
15
17.0
36
22.3
2
11.4
6
36.2
67
95.0
194
75.7
107
71.2
56
69.1
250
81.7
67
75.9
113
71.3
8
44.9
10
55.1
16
6.1
10
6.4
5
5.6
7
2.2
6
7.1
10
6.4
8
43.8
2
8.7
71 100.0
256 100.0
150 100.0
81 100.0
306 100.0
88 100.0
Party Total
AfrAmer ƒ %
159 100.0
18 100.0
18 100.0
AgeGroup Republican ƒ %
Independent ƒ %
18-29 ƒ
30-49 %
ƒ
50-64 %
ƒ
65+ %
ƒ
%
Yes
109
18.1
49
18.8
43
20.4
16
12.9
2
3.4
40
16.7
32
20.1
30
26.1
No
459
76.5
197
75.5
164
76.8
98
78.1
55
96.6
185
76.9
121
75.0
79
68.4
NS
32
5.4
15
5.8
6
2.8
11
9.1
16
6.5
8
4.9
6
5.6
600
100.0
261
100.0
213
100.0
126
100.0
241
100.0
161
100.0
115
100.0
Total
Total Total ƒ
Education No College College Degree Degree+ ƒ % ƒ %
Total %
ƒ
%
57
100.0
Income < $25K ƒ
$25-35K ƒ %
%
$35-50K ƒ %
$50-75K ƒ %
$75-100K ƒ %
$100+ ƒ
%
Yes
109
18.1
109
18.1
50
20.2
57
16.3
17
26.8
8
12.7
18
25.7
11
12.4
15
19.1
19
12.9
No
459
76.5
459
76.5
172
70.0
287
81.6
41
65.8
41
64.5
47
68.0
76
87.1
63
78.6
123
85.5
NS
32
5.4
32
5.4
24
9.7
8
2.2
5
7.4
15
22.8
4
6.3
0
.4
2
2.3
2
1.5
600
100.0
600
100.0
246
100.0
351
100.0
63
100.0
64
100.0
69
100.0
87
100.0
81
100.0
144
100.0
Total
Zogby International
9
12/4/2009
Poll of Houston Likely Voters - 12/2/09 thru 12/4/09 MOE +/- 4.1 Percentage Points
9. Will Annise Parker's sexual orientation cause you to vote against her? Gender Male
Total ƒ
%
ƒ
Female
%
ƒ
%
ƒ
Yes
68
62.7
33
65.0
35
60.7
No
35
32.3
16
32.3
19
NS
5
5.0
1
2.7
4
Total
109 100.0
50 100.0
AgeGroup-B 35-54 55-69
25-34 %
ƒ
4 100.0
%
ƒ
70+ %
ƒ
White %
ƒ
Race AfrAmer
Hisp %
ƒ
%
ƒ
ƒ
21
62.2
11
53.1
33
66.6
8
54.9
22
63.0
32.3
12
26.6
11
32.5
9
44.6
15
30.2
7
45.1
11
30.8
1
7.0
3
6.8
2
5.3
0
2.2
2
3.1
2
6.2
1
58 100.0
4 100.0
47 100.0
34 100.0
20 100.0
49 100.0
15 100.0
Independent ƒ %
18-29 ƒ
68
62.7
32
65.1
31
70.7
5
33.8
No
35
32.3
17
34.0
11
26.2
7
NS
5
5.0
0
.9
1
3.1
109
100.0
49
100.0
43
100.0
Total Total ƒ
Education No College College Degree Degree+ ƒ % ƒ %
Total %
ƒ
%
36 100.0
ƒ
%
5
70.6
50.4
1
18.6
49.6
1
10.8
2 100.0
6 100.0
AgeGroup Republican ƒ %
Yes
Total
Other
%
66.5
Democratic ƒ %
%
Asian ƒ
31
Party Total
%
30-49 %
2
ƒ
ƒ
65+ %
ƒ
%
27
67.4
21
64.6
17
55.2
43.8
11
27.1
9
26.8
13
43.2
4
22.5
2
5.4
3
8.6
0
1.5
16
100.0
40
100.0
32
100.0
30
100.0
2
100.0
50-64 %
100.0
Income < $25K ƒ
%
$25-35K ƒ %
$35-50K ƒ %
$50-75K ƒ %
$75-100K ƒ %
$100+ ƒ
%
Yes
68
62.7
68
62.7
28
56.2
39
69.0
10
58.3
3
41.0
13
72.3
8
71.5
11
70.2
9
47.1
No
35
32.3
35
32.3
19
38.1
15
26.5
4
24.7
5
59.0
5
27.7
2
16.2
5
29.8
10
52.9
NS
5
5.0
5
5.0
3
5.7
3
4.5
3
16.9
1
12.3
109
100.0
109
100.0
50
100.0
57
100.0
17
100.0
11
100.0
15
100.0
19
100.0
Total
Zogby International
10
8
100.0
18
100.0
12/4/2009
Poll of Houston Likely Voters - 12/2/09 thru 12/4/09 MOE +/- 4.1 Percentage Points
10. Is Gene Locke's past work and association with Metro and the Harris County -Houston Sports Authority a factor you will consider in determining which candidate is best fit for mayor? Total ƒ %
Gender Male ƒ %
Female ƒ %
Yes
268
44.6
131
45.4
136
43.9
6
36.2
34
47.5
103
40.1
76
50.9
44
54.3
138
45.0
37
41.5
76
47.9
6
34.0
9
50.6
No
289
48.2
143
49.3
146
47.1
10
63.8
34
47.3
133
51.9
64
42.6
30
36.8
149
48.5
46
52.2
72
45.4
8
44.9
5
29.8
NS
43
7.2
15
5.2
28
9.0
4
5.2
21
8.1
10
6.6
7
8.9
20
6.5
6
6.3
11
6.7
4
21.1
3
19.6
Total
600 100.0
289 100.0
18-24 ƒ %
311 100.0
16 100.0
AgeGroup-B 35-54 ƒ %
25-34 ƒ %
71 100.0
55-69 ƒ %
256 100.0
70+ ƒ
150 100.0
White ƒ %
%
81 100.0
ƒ
306 100.0
ƒ
%
Asian ƒ
159 100.0
Other ƒ %
%
18 100.0
18 100.0
AgeGroup
Democratic
Republican
Independent
ƒ
ƒ
ƒ
%
%
88 100.0
Party Total
Race AfrAmer ƒ %
Hisp
%
18-29
%
ƒ
30-49 %
ƒ
50-64 %
ƒ
65+ %
ƒ
%
Yes
268
44.6
109
41.6
95
44.5
65
51.2
26
45.5
99
41.1
76
47.2
61
53.4
No
289
48.2
136
52.1
106
50.0
46
36.9
28
48.1
122
50.6
79
49.2
41
36.1
NS
43
7.2
16
6.3
12
5.6
15
11.9
4
6.4
20
8.3
6
3.6
12
10.5
600
100.0
261
100.0
213
100.0
126
100.0
57
100.0
241
100.0
161
100.0
115
100.0
Total
Total Total ƒ
Education No College College Degree Degree+ ƒ % ƒ %
Total %
ƒ
%
Income < $25K ƒ
$25-35K ƒ %
%
$35-50K ƒ %
$50-75K ƒ %
$75-100K ƒ %
$100+ ƒ
%
Yes
268
44.6
268
44.6
106
42.8
161
45.7
33
53.1
27
41.9
34
50.0
37
42.8
31
38.0
72
50.5
No
289
48.2
289
48.2
112
45.5
177
50.4
26
41.4
30
47.0
27
39.9
49
55.6
47
58.1
63
44.1
NS
43
7.2
43
7.2
29
11.7
14
3.9
3
5.5
7
11.1
7
10.1
1
1.6
3
3.8
8
5.4
600
100.0
600
100.0
246
100.0
351
100.0
63
100.0
64
100.0
69
100.0
87
100.0
81
100.0
144
100.0
Total
Zogby International
11
12/4/2009
Poll of Houston Likely Voters - 12/2/09 thru 12/4/09 MOE +/- 4.1 Percentage Points
11. Will Gene Locke's past work for and association with Metro and the Sports Authority cause you to vote against him? Gender Total ƒ % Yes
AgeGroup-B
Male ƒ
Female ƒ %
%
18-24 ƒ %
85
31.7
41
31.6
44
31.9
No
152
56.6
74
56.6
77
56.6
NS
31
11.6
16
11.8
16
11.4
Total
268 100.0
131 100.0
6 100.0
136 100.0
6 100.0
25-34 ƒ %
Race
35-54 ƒ %
55-69 ƒ %
70+ ƒ
White ƒ %
%
Hisp ƒ
ƒ Yes
Democratic ƒ %
%
%
Asian ƒ
34.9
26
25.5
31
40.2
14
32.6
56
40.9
13
35.7
12
15.9
11
31.7
67
65.0
39
50.8
27
61.1
70
50.9
23
61.6
48
63.1
5
11
33.4
10
9.4
7
9.0
3
6.3
11
8.2
1
2.7
16
21.0
1
34 100.0
103 100.0
76 100.0
44 100.0
138 100.0
37 100.0
76 100.0
Other ƒ %
%
12
Party Total
AfrAmer ƒ %
2
26.7
83.5
5
52.8
16.5
2
20.6
6 100.0
9 100.0
AgeGroup Republican ƒ %
Independent ƒ %
18-29 ƒ
30-49 %
ƒ
50-64 %
ƒ
65+ %
ƒ
%
85
31.7
27
25.1
37
38.8
21
32.5
4
13.8
30
30.7
26
34.7
23
36.9
No
152
56.6
64
58.8
54
56.7
34
53.0
11
43.1
61
62.0
41
54.2
35
57.0
NS
31
11.6
17
16.1
4
4.6
9
14.5
11
43.1
7
7.3
8
11.1
4
6.1
268
100.0
109
100.0
95
100.0
65
100.0
26
100.0
99
100.0
76
100.0
61
100.0
Total
Total Total ƒ Yes
Total %
ƒ
%
Education No College College Degree Degree+ ƒ % ƒ %
Income < $25K ƒ
$25-35K ƒ %
%
$35-50K ƒ %
$50-75K ƒ %
$75-100K ƒ %
$100+ ƒ
%
85
31.7
85
31.7
30
28.5
55
34.2
2
5.2
10
39.0
11
31.5
17
45.9
9
29.4
23
32.3
No
152
56.6
152
56.6
66
62.3
84
52.5
21
62.5
16
58.7
22
64.5
13
35.9
19
60.7
45
61.7
NS
31
11.6
31
11.6
10
9.2
21
13.3
11
32.3
1
2.3
1
4.0
7
18.3
3
10.0
4
5.9
268
100.0
268
100.0
106
100.0
161
100.0
33
100.0
27
100.0
34
100.0
37
100.0
31
100.0
72
100.0
Total
Zogby International
12
12/4/2009
Poll of Houston Likely Voters - 12/2/09 thru 12/4/09 MOE +/- 4.1 Percentage Points
12. Which candidate do you think is better equipped to deal with the financial and economic problems facing the city? Gender Total ƒ
AgeGroup-B
Male
%
ƒ
Female %
ƒ
18-24
%
ƒ
%
25-34 ƒ
Race
35-54
%
ƒ
55-69
%
ƒ
70+ %
ƒ
White %
ƒ
Hisp
%
ƒ
AfrAmer %
ƒ
%
Parker
303
50.4
150
51.8
153
49.1
8
49.6
34
48.3
124
48.5
81
54.1
43
53.3
178
58.1
56
63.1
48
30.4
Locke
2
14.3
22
31.5
74
28.8
36
23.8
20
25.3
63
20.6
18
20.0
71
44.5
6
8.9
18
7.0
8
5.2
5
5.8
26
8.6
4
4.7
2
1.3
8
11.3
40
15.7
25
16.9
13
15.6
39
12.8
11
12.2
38
23.7
160
26.7
78
27.1
82
26.4
Neither
39
6.5
26
8.8
13
4.3
NS
98
16.4
36
12.3
63
20.1
Total
600 100.0
289 100.0
311 100.0
6
36.2
16 100.0
71 100.0
256 100.0
150 100.0
81 100.0
306 100.0
88 100.0
Party Total ƒ
Democratic ƒ %
%
159 100.0
Asian ƒ
Other
%
9
ƒ
50.6
9
49.4
18 100.0
%
9
48.7
7
40.2
2
11.0
18 100.0
AgeGroup Republican ƒ %
Independent ƒ %
18-29 ƒ
30-49 %
ƒ
50-64 %
ƒ
65+ %
ƒ
%
Parker
303
50.4
138
52.8
98
46.0
67
53.0
34
59.1
114
47.2
80
49.7
63
55.2
Locke
160
26.7
85
32.5
50
23.7
25
20.0
11
19.8
68
28.1
49
30.5
26
23.0
Neither
39
6.5
4
1.6
33
15.3
2
1.7
6
11.0
17
7.0
6
3.7
7
6.4
NS
98
16.4
34
13.1
32
15.0
32
25.4
6
10.1
43
17.7
26
16.1
18
15.5
600
100.0
261
100.0
213
100.0
126
100.0
57
100.0
241
100.0
161
100.0
115
100.0
Total
Zogby International
13
12/4/2009
Poll of Houston Likely Voters - 12/2/09 thru 12/4/09 MOE +/- 4.1 Percentage Points
12. Which candidate do you think is better equipped to deal with the financial and economic problems facing the city? Total Total ƒ
Education No College College Degree Degree+ ƒ % ƒ %
Total %
ƒ
%
Income < $25K ƒ
$25-35K ƒ %
%
$35-50K ƒ %
$50-75K ƒ %
$75-100K ƒ %
$100+ ƒ
%
Parker
303
50.4
303
50.4
109
44.3
192
54.8
26
41.3
34
52.6
29
42.8
49
56.0
49
60.4
78
54.6
Locke
160
26.7
160
26.7
65
26.6
94
26.9
21
33.4
14
21.3
23
33.6
20
23.3
22
27.7
42
29.4
Neither
39
6.5
39
6.5
25
10.2
14
3.9
1
1.4
4
6.3
8
9.0
6
6.9
9
6.5
NS
98
16.4
98
16.4
47
18.9
51
14.4
15
23.9
17
26.1
12
17.4
10
11.7
4
5.0
14
9.5
600
100.0
600
100.0
246
100.0
351
100.0
63
100.0
64
100.0
69
100.0
87
100.0
81
100.0
144
100.0
Total
Zogby International
14
12/4/2009
Poll of Houston Likely Voters - 12/2/09 thru 12/4/09 MOE +/- 4.1 Percentage Points
13. Which candidate do you think is better equipped to deal with the illegal immigration in the city? Gender Total ƒ
%
AgeGroup-B
Male ƒ
Female %
ƒ
18-24
%
ƒ
%
25-34 ƒ
%
35-54 ƒ
Race 55-69
%
ƒ
70+ %
ƒ
White %
ƒ
Hisp
%
ƒ
AfrAmer %
ƒ
%
Asian ƒ
Parker
171
28.6
72
25.0
99
31.9
28
39.7
79
30.8
36
23.8
23
28.1
87
28.5
33
37.8
42
26.5
Locke
194
32.4
100
34.4
95
30.4
22
30.4
81
31.5
61
40.3
27
33.6
70
22.8
38
43.1
75
47.0
4
13
17.7
35
13.8
21
14.1
8
10.2
53
17.3
3
3.8
14
8.7
9
12.2
61
23.9
33
21.8
23
28.2
96
31.4
13
15.2
28
17.8
Neither
81
13.5
48
16.6
33
10.7
NS
153
25.5
69
23.9
84
27.0
16 100.0
Total
600 100.0
311 100.0
16 100.0
289 100.0
71 100.0
256 100.0
150 100.0
81 100.0
306 100.0
88 100.0
Party Total ƒ
%
Democratic ƒ %
159 100.0
Other
%
ƒ
%
6
35.8
22.7
6
31.6
3
17.5
2
9.5
11
59.8
4
23.1
18 100.0
18 100.0
AgeGroup Republican ƒ %
Independent ƒ %
18-29 ƒ
30-49 %
ƒ
50-64 %
ƒ
65+ %
ƒ
%
Parker
171
28.6
92
35.4
42
19.9
37
29.0
21
36.0
75
31.1
39
24.2
31
27.2
Locke
194
32.4
95
36.5
65
30.7
33
26.4
11
18.7
69
28.7
73
45.4
37
32.2
Neither
81
13.5
19
7.3
39
18.5
23
18.2
10
17.4
33
13.7
20
12.7
14
11.9
NS
153
25.5
54
20.8
66
30.9
33
26.4
16
27.9
64
26.5
28
17.6
33
28.8
Total
600
100.0
261
100.0
213
100.0
126
100.0
57
100.0
241
100.0
161
100.0
115
100.0
Zogby International
15
12/4/2009
Poll of Houston Likely Voters - 12/2/09 thru 12/4/09 MOE +/- 4.1 Percentage Points
13. Which candidate do you think is better equipped to deal with the illegal immigration in the city? Total Total ƒ
Total %
ƒ
%
Education No College College Degree Degree+ ƒ % ƒ %
Income < $25K ƒ
$25-35K ƒ %
%
$35-50K ƒ %
$50-75K ƒ %
$75-100K ƒ %
$100+ ƒ
%
Parker
171
28.6
171
28.6
71
28.7
101
28.7
20
31.7
23
36.9
23
33.8
19
22.1
31
38.2
38
26.7
Locke
194
32.4
194
32.4
84
34.0
110
31.3
25
39.1
16
25.9
29
42.6
35
39.7
22
26.7
41
28.5
81
13.5
81
13.5
29
11.8
52
14.8
2
3.9
7
11.5
9
12.8
14
15.5
7
8.8
31
21.5
NS
153
25.5
153
25.5
63
25.6
88
25.2
16
25.3
16
25.8
7
10.8
20
22.7
21
26.3
33
23.3
Total
600
100.0
600
100.0
246
100.0
351
100.0
63
100.0
64
100.0
69
100.0
87
100.0
81
100.0
144
100.0
Neither
Zogby International
16
12/4/2009
Poll of Houston Likely Voters - 12/2/09 thru 12/4/09 MOE +/- 4.1 Percentage Points
14. Which candidate do you think is better equipped to deal with crime in the city? Gender Total ƒ
AgeGroup-B
Male
%
ƒ
Female %
ƒ
18-24
%
ƒ
Parker
187
31.1
81
28.0
106
34.0
Locke
259
43.1
135
46.6
124
39.8
Neither
43
7.2
28
9.6
15
5.0
NS
111
18.6
46
15.8
66
21.2
Total
600 100.0
289 100.0
311 100.0
%
8
8
49.6
25-34 ƒ
%
ƒ
55-69
%
ƒ
70+ %
ƒ
White %
ƒ
Hisp
%
ƒ
ƒ
Democratic ƒ %
%
%
ƒ
%
Asian ƒ
Other
%
ƒ
%
27.6
86
33.8
48
32.1
26
32.0
113
36.8
42
47.2
24
15.0
2
9.3
5
29.7
36
50.6
102
39.9
71
47.0
33
40.3
101
32.9
27
30.3
104
65.4
15
85.0
9
53.5
8
10.6
20
7.7
9
6.1
7
8.2
29
9.6
4
4.7
2
1.4
1
5.5
8
11.3
48
18.6
22
14.8
16
19.4
63
20.6
16
17.8
29
18.2
2
11.2
71 100.0
256 100.0
150 100.0
81 100.0
306 100.0
88 100.0
Party Total
AfrAmer
20
50.4
16 100.0
Race
35-54
159 100.0
1
5.6
18 100.0
18 100.0
AgeGroup Republican ƒ %
Independent ƒ %
18-29 ƒ
30-49 %
ƒ
50-64 %
ƒ
65+ %
ƒ
%
Parker
187
31.1
91
34.9
59
27.5
37
29.5
15
25.4
81
33.6
46
28.5
39
33.8
Locke
259
43.1
133
50.7
82
38.4
44
35.2
28
49.5
92
38.0
83
51.6
46
40.3
Neither
43
7.2
5
1.9
28
13.1
10
8.1
6
11.0
20
8.2
8
4.7
9
8.2
NS
111
18.6
33
12.5
45
21.0
34
27.1
8
14.1
49
20.2
24
15.2
20
17.7
Total
600
100.0
261
100.0
213
100.0
126
100.0
57
100.0
241
100.0
161
100.0
115
100.0
Zogby International
17
12/4/2009
Poll of Houston Likely Voters - 12/2/09 thru 12/4/09 MOE +/- 4.1 Percentage Points
14. Which candidate do you think is better equipped to deal with crime in the city? Total Total ƒ
Education No College College Degree Degree+ ƒ % ƒ %
Total %
ƒ
%
Income < $25K ƒ
$25-35K ƒ %
%
$35-50K ƒ %
$50-75K ƒ %
$75-100K ƒ %
$100+ ƒ
%
Parker
187
31.1
187
31.1
68
27.5
118
33.6
16
24.8
18
28.7
15
22.4
36
41.0
25
31.5
50
35.0
Locke
259
43.1
259
43.1
114
46.2
144
41.1
34
53.9
36
57.1
40
58.6
32
36.7
35
43.1
55
38.6
43
7.2
43
7.2
16
6.7
27
7.6
1
.9
3
5.3
2
3.5
3
2.9
8
9.5
21
14.7
NS
111
18.6
111
18.6
48
19.7
62
17.7
13
20.5
6
8.9
11
15.6
17
19.3
13
15.9
17
11.7
Total
600
100.0
600
100.0
246
100.0
351
100.0
63
100.0
64
100.0
69
100.0
87
100.0
81
100.0
144
100.0
Neither
Zogby International
18
12/4/2009
Related Documents

Zobgy Internals
July 2020 5
Internals
April 2020 12
Ptx Internals
December 2019 11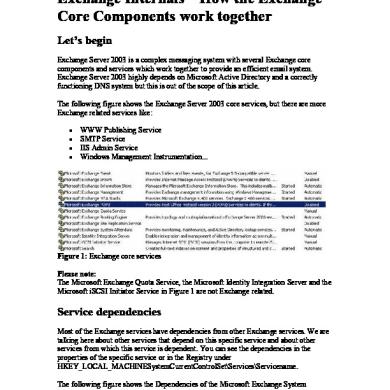
Exchange Internals
May 2020 10
Linux Internals
May 2020 6
Internals%20college.docx
May 2020 7More Documents from "A S Venkat Krishna"
Zobgy Internals
July 2020 5
Christie Ro 120209
July 2020 10