A Study On Training And Development
This document was uploaded by user and they confirmed that they have the permission to share it. If you are author or own the copyright of this book, please report to us by using this DMCA report form. Report DMCA
Overview
Download & View A Study On Training And Development as PDF for free.
More details
- Words: 9,502
- Pages: 76
ABSTRACT “A STUDY ON SATISFACTION OF TRAINING AND DEVELOPMENT PROGRAM CONDUCTED AT SHREE VARI MULTIPLAST INDIA(P)LIMITED” The project title “A study on satisfaction of Training and Development program” in Shree Vari Multiplast India(p) Limited aims to find out the general opinion and satisfaction of the candidates on the training program attended by them in Shree Vari Multiplast India(p) Limited . The aims of training and development can be teaching candidates new skills that are relevant to their current job position or refreshing the skills that they already possess. To have a good training and development program enables firms to develop individual candidates and the organization itself as training is one of the best forms of motivation The research design is descriptive research with the sample size of 150 and hence the sampling type is stratified random sampling. The primary data is collected through questionnaire. The research describes that maximum of the respondents agreed that the training was very effective and they are very much satisfied with the training program offered by Shree Vari Multiplast India(p) Limited. From the research it has been identified that, the training material and the content of the training should be improved. Thus the training program conducted in Shree Vari Multiplast India(p) Limited helps the trainees to develop their potential skills to achieve their given task effectively and efficiently.
TABLE OF CONTENTS LIST OF TABLES TABLE NO 5.1.1
TITLE
PAGE NO
Age group of the respondents
31
5.1.2
Years of experience of the respondents
32
5.1.3
Income of the respondents
33
5.1.4
Trainees opinion on training
34
5.1.5 5.1.6
Type of training attended in their organization Trainee’s opinion on the satisfaction of training given in their organization Employee opinion on the training need suggested by the authority
35 36
Candidate’s opinion about the duration of the training program by Shree Vari Multiplast India(p) Limited Type of training in Shree Vari Multiplast India(p) Limited
38
40
5.1.12
Employees agreement level towards the relevancy & helpfulness of training Opinion regarding the satisfaction level of training program by Shree Vari Multiplast India(p) Limited Candidates opinion about the job before the training program
5.1.13
Candidates opinion about the job after the training program
43
5.1.14
44
5.1.15.1
Opinion regarding knowledge and skills acquired through the training program Feedback about the trainer
5.1.15.2
Feedback about the course content
46
5.1.15.3
Feedback about the course material
47
5.1.15.4
Feedback about Discussion/Exercise/Case study
48
5.1.15.5
Feedback about the venue arrangements
49
5.1.16
Opinion about the opportunities for giving suggestion
50
5.1.17
Opinion about the recommendation of training to other employees
51
5.1.18
Opinion regarding superior guidance during the training program
52
5.1.19
Opinion regarding the relationship between trainer and trainee
53
5.1.20
Feedback about the training
54
5.1.21.1
Extent of attitude acquired by the respondents - Knowledge
55
5.1.21.2
Extent of attitude acquired by the respondents – Efficiency
56
5.1.7 5.1.8 5.1.9 5.1.10 5.1.11
37
39
41 42
45
5.1.21.3 5.1.21.4
Extent of attitude acquired by the respondents - Skills Extent of attitude acquired by the respondents – Communication Skill Extent of attitude acquired by the respondents – Team work
57 58
5.1.22
Opinion about the effectiveness of training
60
5.2.1
Candidates’ feedback on the various aspects of the training program
61
5.2.2
Candidates’ attitudes acquired from various aspects of the training program Experience and satisfaction level
62
5.1.21.5
5.3.1
LIST OF CHARTS
59
63
TABLE NO
TITLE
PAGE NO
5.1.1
Age group of the respondents
31
5.1.2
Years of experience of the respondents
32
5.1.3
Income of the respondents
33
5.1.4
Trainees opinion on training
34
5.1.5 5.1.6
Type of training attended in their organization Trainee’s opinion on the satisfaction of training given in their organization Employee opinion on the training need suggested by the authority
35 36
Candidate’s opinion about the duration of the training program by Shree Vari Multiplast India(p) Limited Type of training in Shree Vari Multiplast India(p) Limited
38
40
5.1.12
Employees agreement level towards the relevancy & helpfulness of training Opinion regarding the satisfaction level of training program by Shree Vari Multiplast India(p) Limited Candidates opinion about the job before the training program
5.1.13
Candidates opinion about the job after the training program
43
5.1.14
44
5.1.15.1
Opinion regarding knowledge and skills acquired through the training program Feedback about the trainer
5.1.15.2
Feedback about the course content
46
5.1.15.3
Feedback about the course material
47
5.1.15.4
Feedback about Discussion/Exercise/Case study
48
5.1.15.5
Feedback about the venue arrangements
49
5.1.16
Opinion about the opportunities for giving suggestion
50
5.1.17
Opinion about the recommendation of training to other employees
51
5.1.18
Opinion regarding superior guidance during the training program
52
5.1.19
Opinion regarding the relationship between trainer and trainee
53
5.1.20
Feedback about the training
54
5.1.21.1
Extent of attitude acquired by the respondents - Knowledge
55
5.1.21.2
Extent of attitude acquired by the respondents – Efficiency
56
5.1.21.3 5.1.21.4
Extent of attitude acquired by the respondents - Skills Extent of attitude acquired by the respondents – Communication Skill Extent of attitude acquired by the respondents – Team work
57 58
Opinion about the effectiveness of training
60
5.1.7 5.1.8 5.1.9 5.1.10 5.1.11
5.1.21.5 5.1.22
37
39
41 42
45
59
5.2.1
Candidates’ feedback on the various aspects of the training program
61
5.2.2
Candidates’ attitudes acquired from various aspects of the training program Experience and satisfaction level
62
5.3.1
1. INTRODUCTION TRAINING:
63
Employee training is the most important sub-system of Human Resource Development. After an employee is selected, placed and introduced in an organization he or she must be provided with training facilities in order to adjust him to the job. Training can be described as “the acquisition of knowledge, skills, concepts or attitudes that result in improved performance within the job environment”. Training analysis looks at each aspect of an operational domain so that the initial skills, concepts and attitudes of the human elements of a system can be effectively identified and appropriate training can be specified. Training analysis as a process often covers:
Review of current training
Task analysis (of new or modified system)
Identification of training gap
Statement of training requirement
Assessment of training options
Cost benefit analysis of training options
Training Analysis is most often used as part of the system development process. Due to the close tie between the design of the system and the training required, in most cases it runs alongside the development to capture the training requirements. Training is an organized process for increasing knowledge and skills of people for a definite purpose. The purpose of training is to improve the employee’s current job performance. An organization that aspires to grow must be in tune with the changing need of the society. Training reduces the gap by increasing employee’s knowledge, skill, ability and attitude. For the proper functioning of any business organization, the management of the organization concerned must employ a training program to groom its associates with business skill and practical knowledge. In addition to a standard training program, there must be a certain measure of training performance.
Training makes a very important contribution to the development of the organizations Human Resource and hence to the achievement of its aims and objectives. It improves changes and moulds the employee’s knowledge, skill, behavior and attitude towards the requirement of the job and the organization. The importance of the training and development are many in number. Primarily it helps in the optimization of the utilization of human resources that ultimately provides the candidates as well as the individuals to achieve the goals. It also helps in improving the human resources technical and behavioral skills which leads in attaining personal growth of the candidates. BENEFITS OF TRAINING: Training enables the employee to attain the following benefits, 1. QUICK LEARNING: Training helps to reduce the learning time to reach the acceptable level of performance. 2. HIGHER PRODUCTIVITY: Training increases the skill of the new employee in his performance of a particular job. 3. STANDARDISATION OF PROCEDURES: With the help of training, the best available methods of performing the work can be standardized and taught to all candidates. 4. LESS SUPERVISION: Training does not eliminate the need for supervision, but it reduces the need for detailed and constant supervision.
5. ECONOMICAL OPERATIONS: Trained personnel will be able to make better and economical use of materials and equipments. 6. REDUCED ACCIDENTS:
Proper training in both job skills and safety attitudes should contribute towards a reduction in the accident rate. 7. HIGHER MORALE: A good training program will mould candidates attitudes towards organizational activities and generate better co-operation and greater loyalty. TYPES OF TRAINING: On the basis of purpose, several types of training programs are offered to the candidates. They are, 1. INDUCTION OR ORIENTATION TRAINING: Induction is concerned with introducing or orienting a new employee to the organization and its procedures, rules and regulations. 2. JOB TRAINING: Job training is the most common in plant training programs. It relates to specific job which the worker has to handle. It develops skills and confidence among the workers. 3. APPRENTICESHIP TRAINING: This training program tends more towards education than merely on the vocational training. Under this, both knowledge and skills are developed. 4. INTERNSHIP TRAINING: Under this method, an educational or vocational institute enters into arrangement with an industrial enterprise for providing practical knowledge to its students. 5. REFRESHER TRAINING OR RETRAINING: Basic purpose of refresher training is to acquaint the existing workforce with the latest methods of performing their jobs and improve their efficiency further. 6. TRAINING FOR PROMOTION:
The talented candidates may be given adequate training to make them eligible for promotion to higher jobs in the organization. 7. REMEDIAL TRAINING: This training is required to remove defective way of doing work and teach them correct methods and behavior patterns. 8. SAFETY TRAINING: To prevent industrial accidents, training is necessary. Instructions to use safety devices can be given. METHODS OF TRAINING: There are three different types of methods to train the candidates. They are as follows. 1. ON THE JOB TRAINING: 2. OFF THE JOB TRAINING. 3. VESTIBULE TRAINING.
ON THE JOB TRAINING The worker is given training at the work place by his immediate supervisor. Worker learns in an actual work environment. The different types of on the job training are, a. COACHING: Supervisor gives direct instruction and guidance to the trainee. He demonstrates how to do the job. b. UNDERSTUDY: Candidate becomes an assistant to current job holder. He learns by experience and observation. c. JOB ROTATION:
Trainee is periodically rotated from job to job. He learns a variety of tasks and develops a better view of the organization. d. POSITION ROTATION: Used by many organizations to develop all round workers. OFF THE JOB TRAINING: It requires workers to undergo training for a specific period away from the work place. Concerned with both knowledge and skills in doing certain jobs. The different types of off the job training are, a. SPECIAL LECTURE CUM DISCUSSION: Some executives of the organization or specialists from vocational and professional institutes may deliver special lectures. b. CONFERENCE TRAINING: A conference is a group meeting conducted according to an organized plan in which the members seek to develop knowledge and understanding by oral participation. c. CASE STUDY: The trainees are given a problem or case, which is more or less related to the concepts and principles already taught. d. ROLEPLAY: Conflict is artificially created and the trainees are assigned different roles to play. Trainees are given a description of the situation and role they are to play. VESTIBULE TRAINING: Vestibule training is used to designate training in a class room for semi-skilled jobs, where large number of candidates must be trained at the same time for the same kind of work.
A vestibule school is established in an industrial plant. An attempt is made to duplicate as nearly as possible, the actual material, equipment and conditions found in the real workplace. Qualified instructors are employed. Initial nervousness of the trainees is also removed. Trainees do not contribute to production during the training period. Line managers will blame the instructors if trainee’s performance is poor. Since it is an expensive method, it cannot be applied in small organizations. It is used to give training to candidates in large numbers.
2.INDUSTRY ANALYSIS
Plastics are a wide array of semi-synthetic or synthetic organic solids that are transformed or molded into several useful products. Plastics are usually organic polymers
derived from petrochemicals or sometimes occur naturally and have high molecular weights. The global plastic market is governed by the end user industry application. Owing to their low cost, ease of manufacture, availability of raw materials and flexibility of use, plastics have displaced many conventional materials including wood, paper, metal, ceramic, leather and glass in the majority of their uses. The increasing demand for sustainable and durable products in various end-user industries is driving demand for various plastics globally. The growth of major end use industries (mainly packaging and construction) and versatile properties of plastics including better heat and pressure resistance, make them more applicable in various industries. Volatility prices of key raw materials coupled with growing environmental concerns regarding plastic disposal are expected to hinder market growth over the forecast period. To overcome such challenges, the industry has shifted its focus towards developing bio-based alternatives to conventional (petroleum-based) plastics. Major plastics manufacturers have been forming JV and have been collaborating with biotechnology companies to synergize their functions to manufacture bio-based plastics. Moreover, upcoming technologies to recycle plastics for the manufacturing plastics into fabric for various end user products show immense opportunities for the plastic market. Major plastics manufacturers from the western hemisphere of the world have to focus on setting up manufacturing facilities in high-growth regions such as the Middle East and Asia Pacific. These regions along with providing consistent demand for plastics also help in reducing the overall cost of manufacturing. Regulatory support in the form of tax benefits and financial incentives in countries such as China and India, to increase the FDI flow, has been a key factor in market development in Asia. In addition, these regions offer low labor cost which further helps in reducing the overall manufacturing cost for producers. However, this shift has resulted in an overcapacity of various plastics products which have affected their prices Manufacturing is
the
production
of merchandise for
use
or
sale
using
labour
and machines, tools, chemical and biological processing, or formulation. The term may refer to a range of human activity, from handicraft to high tech, but is most commonly applied to industrial production, in which raw materials are transformed into finished goods on a large scale. Such finished goods may be sold to other manufacturers for the production of other, more
complex
products,
such
as aircraft, household
appliances, furniture, sports
equipment or automobiles, or sold to wholesalers, who in turn sell them to retailers, who then sell them to end users and consumers. Manufacturing engineering or manufacturing process are the steps through which raw materials are transformed into a final product. The manufacturing process begins with the
product design, and materials specification from which the product is made. These materials are then modified through manufacturing processes to become the required part. Modern manufacturing includes all intermediate processes required in the production and integration
of
a
product's
components.
Some
industries,
such
as semiconductor and steel manufacturers use the term fabrication instead. The manufacturing sector is closely connected with engineering and industrial design. Examples
of
major
Corporation, General and Precision
manufacturers
Electric, Procter
Castparts.
in North &
Examples
Group, Siemens, FCA and Michelin.
America include General
Gamble, General in
Europe
Examples
Motors
Dynamics, Boeing, Pfizer, include Volkswagen in
Asia
include Toyota, Yamaha, Panasonic, Mitsubishi, LG, Samsung and Tata Motors.
History and Development
In its earliest form, manufacturing was usually carried out by a single skilled artisan with assistants. Training was by apprenticeship. In much of the preindustrial world, the guild system protected the privileges and trade secrets of urban artisans.
Before the Industrial Revolution, most manufacturing occurred in rural areas, where household-based manufacturing served as a supplemental subsistence strategy to agriculture (and continues to do so in places). Entrepreneurs organized a number of manufacturing households into a single enterprise through the putting-out system.
Toll manufacturing is an arrangement whereby a first firm with specialized equipment processes raw materials or semi-finished goods for a second firm.
Data Collection Matrix Perspective Supply side
Primary research Manufacturers
Secondary research Company reports and
Raw material suppliers
publications Government publications
Product distributors and
Independent investigations
wholesalers
Economic and demographic data Demand side
End-user surveys
Case studies
Consumer surveys
Reference customers
Mystery shopping
Industry Analysis Matrix Qualitative analysis Industry landscape and trends Market dynamics and key issues Technology landscape Market opportunities Porter’s analysis and PESTEL analysis Competitive landscape and product benchmarking Policy and regulatory scenario
3.COMPANY PROFILE a) COMPANY ORIGIN
Quantitative analysis Market revenue estimates and forecast up to 202
Market revenue estimate and forecast up to 2020 by product
Regional market revenue forecast up to 2020, by application
SHREE VARI MULTIPLAST INDIA(P)LIMITED
MANUFACTURING INDUSTRY: The ornate and Metallic Color Series of Chairs in a range of elegant shades are trailblazers that stand unrivalled to this day. Stools, Tables, Trolleys and Baby Chairs also fit pretty in ‘’VV National wide comprehensive range Made from 100 % Virgin and Tailor made Composition as required by the customer used Latest designed imported Mould’s. ”VV National” Furniture reflects quality style and functionality that has made it the leader at home and winner overseas. Providing technologically superior products and shape focus on lacquered furniture and other premium range items are key elements of the company’s strategic vision of excellence for the future. OVERVIEW Founded:
1999
Headquaters:
Perundurai, TamilNadu
Status:
Private, Independent Company
Managing Director:
Mr.V.Senthil Murugan
Director:
Mr.S.Vivek Karthic
No.of.Employes:
300
Estimated Annual Revenue:
10 Crores
b) VISION AND MISSION VISION:
Build VVNational to be the most dependable business partner in the region through exceptional service and value addition. Vision 2020 Our vision 2020 is “Growing the business by improving and optimizing human skills, effective use of technology and creating employment for a team of 10000 dedicated workforce”. Vision 2025 Our vision 2025 is “Achieving 300% Growth by synergizing Innovation Technology and Manpower skills within the VVNational Group resulting in 15000 jobs”. MISSION: MAKE IT HAPPEN Make VVNational the leader in our chosen markets by creating an environment to attract and retain a committed team of talented professionals. PRODUCTS FURNITURES: PREMIUM MONO BLOCK CHAIRS MONO BLOCK CHAIRS MONO BLOCK CHAIRS WITHOUT ARM EXECUTIVE CHAIRS CENTER TABLES AND TROLLEYS DINNING TABLES BABY CHAIRS STOOLS BATH STOOLS AND PATALS MATERIAL HANDLING: FRUIT AND VEGETABLE CRATE MULTI PURPOSE CRATES GHAMELA BIG GHAMELA SMALL MILK CRATES JUMBO FISH CRATES
SUBORDINATE OF VV GROUP
VV G RO UP BEACH MINERAL
TEXTILE
CHEMICAL
IT & MEDIA
STONE AGGREGATES
POLYMER
FOOD & AGRO
CHARITABLE ORGANISATIONS
Industrial Training: Junior Level Engineering Programs
Fitting practices and assembly
Metrology and measuring instruments
Machining processes
Workshop calculation & science
Engineering Drawing
Welding techniques
Heat treatment
Cutting tools
Electrical & Electronics
Soldering techniques
Computer applications
Quality systems
Plumbing
Finance & Accounts
Soft Skills Middle Management programs for Manufacturing Industry
CNC Programming & Machining
GD &T
Maintenance of Equipments & machines
Pneumatics
Electro Pneumatics
Hydraulics
Electro Hydraulics
PLC
Micro Controller
Auto CAD
Pro –E
Inventor- 2009
Tool Design
Painting
Maintenance Management and Material handling
Quality systems
Manufacturing Systems
Marketing Management
Human Resource Management
Financial Management & Accounting
General and Operational Management
Vendor Management
Personal Productivity Skills.
Case Studies Customized training programs offered at our centre Case Study 1: Name of the Company : Ashok Leyland Name of the Program : Mechatronics Duration Target Group
: 20 days : Maintenance Personnel
Trained Manpower
: 30
Modules Selected: Electrical and Electronics PLC Electro Pneumatics Electro Hydraulics CNC Case Study 2: Name of the Company
: Wabco India Ltd
Name of the Program
: General Technical Competency
Duration
: 100 days
Target Group
: Company Apprentices ( +2 )
Trained Manpower
: 250
No. of Participants Undergoing Training: 20 Modules Selected: Machining processes Metrology and Measuring Instruments Fitting Practice and Assembly Cutting Tools Engineering Drawing Workshop Calculations Pneumatics & Hydraulics CNC Quality Systems and Soft Skills Case Study 3: Name of the Company
: RANE Group Companies
Name of the Program
: Skill Up-gradation Program
Duration
: 40 Days
Target Group
: Fresh Diploma Holders
Trained Manpower
: 215
Modules Selected Machining processes Fitting Practice and Assembly Cutting Tools Pneumatics Hydraulics CNC Quality Systems Soft Skills Case Study 4: Name of the Company
: NOKIA India Limited
Name of the Program
: Electro–Pneumatics & PLC
Duration
: 5 days / module
Target Group
: Technicians
Trained Manpower
: 300
Modules Selected Pneumatics Electro Pneumatics PLC Case Study 5: Name of the Company
: Sundaram Clayton - Padi
Name of the Program
: General Technical Competency
Duration
: 16 Days
Target Group
: Higher Secondary Pass (+2)
Trained Manpower
: 120
Trained Manpower
: 300
Modules Selected Machining processes Measuring Instruments Engineering Drawing Workshop Calculations & Science CNC Programming CNC Machining Case Study 6: Name of the Company
: Saint Gobain Ltd - Bhutan
Name of the Program
: General Technical Competency Training
Duration
: 24 days
Target Group
: Team Leaders
Trained Manpower
: 25
Modules Selected Industrial Safety Engineering Drawing Maintenance of Equipments Electrical and Electronics Metrology and Measuring Instruments
Material Handling Equipments PLC Quality Concepts Soft Skills Case Study 7: Name of the Company
: WIL – Wardha, Nagpur
Name of the Program
: General Technical Competency
Duration
: 54 Days
Target Group
: Higher Secondary Pass (+2)
Trained Manpower
: 30
Modules Selected Measuring Instruments Fitting Practice and Assembly Engineering Drawing Workshop Calculations Welding Techniques Quality Systems Soft Skills Machining processes
Case Study 8: Name of the Company
: Visteon India Limited
Name of the Program
: Team Member - Training Program
Duration
: 10 days
Target Group
: ITI Technicians
Trained Manpower
: 33
Modules Selected Basics of Physics Engineering Drawing Engineering Materials Electrical and Electronics Pneumatics and Hydraulics Design of Jigs and Fixtures
Welding Plastics and Moulding Methods Soft Skills Case Study 9 Name of the Company
: Lucas TVS
Name of the Program
: Skill Up-gradation Program
Duration
: 30 days
Target Group
: Graduate Engineers
Trained Manpower
: 50
Modules Selected Machining processes Cutting Tools Pneumatics Electro Pneumatics Hydraulics
4. REVIEW OF LITERATURE William James (1998, P.18) of Harvard University reports that employee could retain their jobs by working at mere 20-30 percent of their potential. His research led him to believe that if these same candidates were properly motivated, they could work at 80-90 percent of their capabilities. Behavioral science concepts like motivation and enhanced productivity could well be used for such improvement through the effective and efficient use of learning resources. Jack Welch (1999, P.21) Companies can't promise lifetime employment, but by constant training and education we may be able to guarantee lifetime employability. Organization and individual should develop and progress simultaneously for their survival and attainment of mutual goals. So every modern management has to develop the organization through human resource development. Employee training is the important subsystem of human resource development. Employee training is a specialized function and is one of the fundamental operative functions for human resources management. C. K. Prahalad (1997 P.8) says that mentoring requires special skills, but it does not require hierarchical position. After an employee is selected, placed and introduced he or she must be provided with by training facilities. Training is the act of increasing the knowledge and skill of an employee for doing a particular job. Training is a short-term educational process and utilizing a systematic and organized procedure by which candidates learn technical knowledge and skills for a definite purpose.
Beach (1996 P.14) define the training as “The organized procedure by which people learn knowledge and /or skill for a definite purpose”. In other words, training improves changes and moulds the employee’s knowledge, skill behavior and aptitude and attitude towards the requirements of the job and the organization. Training refer to the teaching and learning activities carried on for the primary purpose of helping members of an organization to acquire and apply the knowledge, skill, abilities and attitudes needs by a particular job and organization. Robert Haas (1994 P.17) suggest that “You can't train anybody to do anything that he or she doesn't fundamentally believe in”. Training needs are identified on the basis of organizational analysis, job analysis and man analysis. Training program, training methods and course content are to be planned on the basis of training needs. Training needs are those
aspects necessary to perform the job in an organization in which employee is lacking attitude/aptitude, knowledge, and skill. Training needs = Job and organizational requirement Employee specifications Robert Louis Stevenson says it was a world almost without a feature; an empty sky, and empty earth; front and back the line of railway stretched from horizon to horizon, like a cue across a billiard-board. RESEARCH PAPERS: TRAINING AND DEVELOPING A WORK FORCE Singara (edition 2001): This paper is a guide to companies when executing the training of a new work force. The researcher shows how job training is crucial for the workers as well as for the corporations. He indicates that companies are paying more attention to the training and development then to recruiting. There are many changes that are being made to the process of training and developing a new work force mainly towards developing existing skills and acquiring new ones. The paper examines several factors that affect this process such as: government intervention, wages, diversity, globalization...and much more EMPLOYEE TRAINING AND DEVELOPMENT Veerabathra (Edition 2002): This paper looks at employee training as a means of improving an organization and making it more cost-effective. It defines the different types of training, including technical, literal, video, and other types of training used to fulfill the needs of both employer and employee.
EFFECTIVE TRAINING Akshara (Edition 2003): An effective training system would integrate several different processes in order to achieve the objective of a proper training. The first step in any sort of training would be identifying the desired level of knowledge in a measurable form. The next step would be listing out the various qualifications or competencies necessary for taking part in any training system to produce the desired results. After this the trainee would have to undertake the necessary research steps by sourcing materials and other requirements for the training method to function at its best. TRAINING
Chamy (Edition 2004): This paper reports on a study to verify whether training can help organizations and uses a questionnaire to collect empirical data. The author points out that the survey will help identify specific benefits and trends because organizations, like people, have their own individuality and style, and no blue print can be considered a universal fit for all organizations. The paper relates that replacing a skilled and trained employee can be very expensive for an organization in terms of time and money; therefore, organizations are increasingly using training and higher education options in their benefits packages to obtain and retain talent in the organization. TRAINING AND DEVELOPMENT Gulathi (Edition 2005): This paper is about employee training and development. It uses a five-step process to develop the appropriate training program that includes training needs assessment; creation of training materials; the training medium (internal, external); the implementation, and an evaluation plan to determine the effectiveness of the training. EMPLOYEE TRAINING Ashwanthi (Edition 2006): This paper looks at the methods of and motivation for employee training in the service industries, such as hotels and restaurants. The paper begins with an exhaustive overview of the term training, including a detailed recitation of Carter McNamara's six-point rationale for training in "Employee Training and Development: Reasons and Benefits." The author also provides background information about the importance of good trainers and training techniques. BOOKS: Training is more about knowing where we stand at present and to have a vision of where we are going to be in the future. It is when we have set goals and don’t know how to proceed; it is when we want something in life to achieve and don’t know how to reach there and it is what we are dreaming for and how we have to acquire the knowledge to live up to our dreams. Thus providing training opportunities is a key to promote an organization, which will support an individual for his lifelong learning, and to work efficiently in their respective departments.
DEFINITIONS: G.SUBRAMANYAM defined training as, "The trainees shall acquire new manipulative skills, technical knowledge, problem solving ability or attitude so that they are better adjusted to their work environment to achieve the organizational and individual goals". C.B.MEMORIA defined training as, "Training is a process of learning a sequence of programmed behavior. It is application of knowledge. It gives people an awareness of the rules and procedures to guide their behavior .it attempts to improve their performance on the current job or prepare them for an intended job."
4.6 LIMITATIONS OF THE STUDY: The limitations of the study are as follows: The data collected cannot be compared with other company. The study was conducted at smaller scale due to the company’s policy. The findings are only the result of the survey and so it is not applicable for future.
benefits Organizational chart helps build and design the organization structure to meet the business' objectives. Organizational chart can guide the employees to know their rights and responsibilities. Organizational chart help divide the functions of a company, enterprise or department. It also shows the relationships between the organization's staff members. With organizational chart, it's easy to find whether the officer's workload is too heavy. It's easy to find whether the unrelated persons undertake the work of several loose, no relationship.
Find out whether an employee is incompetent in this work at important positions. Make everyone clear within their organizations and improve employee performance. Other departments are also able to understand and enhance the coordination of the organization. It's easy to see the promotion channels open. Some managers can use the organizational chart tool to analysis budget, design work team and generate reports. Organizational chart often outline employee tasks and which manager is responsible f
5. DATA ANALYSIS AND INTERPRETATION 5.1 PERCENTAGE ANALYSIS Table No: 5.1.1 Age group of the respondents S.No 1 2 3 4
Age 25-30 years 31-35 years 36-40 years Above 40 years Total
Chart No: 5.1.1 Age group of the respondents
No of Respondents 124 23 3
Percentage (%) 83 15 2
0 150
0 100
Inference: The above table depicts that the maximum number of respondents, 83% belongs to the age of 25 to 30 years , 15% of the respondents belong to the age group of 31 to 35 years and 2% belong to the age of 36 to 40 years.
Table No: 5.1.2 Year of experience of the respondents: S.No 1 2 3 4
Experiences < 5 years 5 - 10 years 10 - 15 years Above 15 Total
No of Respondents 111 17 21 1 150
Percentage (%) 74 11.3 14 0.7 100
Chart No: 5.1.2 Year of experience of the respondents:
Inferences: The above table depicts that the maximum number of respondents, 74% belongs to the below 5 years of experience and 11.3% of the respondents belong
to the 5 to 10 years of experiences and 14% of the respondents belong to the 10 to 15 years .
Table No: 5.1.3 Income of the Respondents S.No 1 2 3 4
Income < 10000 10000 -20000 20000 30000 Above 30000 Total
No of Respondents 104
Percentage (%) 69.3
32
21.3
14 0 150
9.3 0 100
Chart No: 5.1.3 Income of the Respondents
Inference: The above table clearly shows that 69.3 % of the respondents earns an income of below 10000, 21.3 % of the respondents earns an income of 10000 to 20000 and 9.3% of the respondents earns an income of 20000 to 30000.
Table No: 5.1.4 Trainee’s opinion on Training: S.No 1 2
Options Yes No Total
No of Respondents 82 68 150
Percentage (%) 54.66 45.34 100
Chart No: 5.1.4 Trainee’s opinion on Training:
Inference: The above table clearly shows that 54.66% of the respondents have undergone training in their organization and 45.34% of the respondents did not attend training in their organization.
Table No: 5.1.5 Type of training attended in their organization : S.No 1 2 3 4
Options On the Job Off the job Both None Total
No of Respondents
Percentage (%)
11
7.33
19 53 67 150
12.67 35.33 44.6666667 100
Chart No: 5.1.5 Type of training attended in their organization:
Inference:
The above table shows that 44.66% of the respondents did not attend any type of training , 35.33% have attended both on the job & off the job, 12.66% have attended off the job training and 7.33% have attended on the job type of training.
Table No: 5.1.6 Trainee’s opinion on the satisfaction of training given in their organization: S.No 1 2 3 4 5
Options Highly satisfied Satisfied Neutral Dissatisfied Highly dissatisfied Total
No of Respondents
Percentage (%)
21 60 69 0
14 40 46 0
0 150
0 100
Chart No: 5.1.6 Trainee’s opinion on the satisfaction of Training given in their organization:
Inference: The above table shows that 14% of the respondents are highly satisfied, 40% of the respondents are satisfied and 46% of the candidates stand neutral.
Table No: 5.1.7 Employee opinion on the training need suggested by the authority: S.No 1 2 3
Options Superior Company Others Total
No of Respondents 0 150 0 150
Percentage (%) 0 100 0 100
Chart No: 5.1.7 Employee opinion on the training need suggested by the authority:
Inference: The above table shows that 100% of the respondents are suggested by their company for the need of training in Shree Vari Multiplast India(p)Limited.
Table No: 5.1.8 Candidates’ opinion about the duration of the training program by TVS TS: S.No 1 2 3 L
Options Too long Too short Just enough Total
No of Respondents 27 16 107 150
Percentage (%) 18 11 71 100
Chart No: 5.1.8 Candidates’ opinion about the duration of the training program by TVS TS
Inference: The above table clearly shows that 18% of the respondents feel that the duration is just enough , 11% of the respondents feel that the duration is too short and 71 % of the respondents feel that the duration is too long.
Table No: 5.1.9 Type of training in TVS TS: S.No 1 2
Options On the job Off the job Total
No of Respondents
Percentage (%)
0
0
150 150
100 100
Chart No: 5.1.9 Type of training in TVS TS:
Inference: The above table shows that 100% of the respondents are attending off the job method of training in Shree Vari Multiplast India(p)Limited.
Table No: 5.1.10 Employees agreement level towards the relevancy and helpfulness of training: S.No 1 2 3 4 5
Options Strongly agree Agree Neutral Disagree Strongly disagree Total
No of Respondents
Percentage (%)
78 67 4 0
52 44.7 2.6 0
1 150
0.7 100
Chart No: 5.1.10 Employees agreement level towards the relevancy and helpfulness of training:
Inference: The above table clearly shows that 52% of the respondents strongly agree, 44.7% of the respondents agree, 2.6% of the respondents neither agree nor disagree and 0.7% strongly disagree that the training program was more relevant and helpful.
Table No: 5.1.11 Opinion regarding the satisfaction level of the existing training program by TVS TS: S.No 1 2 3 4 5
Options Highly satisfied Satisfied Neutral Dissatisfied Highly dissatisfied Total
No of Respondents
Percentage (%)
77 72 0 1
51.3 48 0 0.7
0 150
0 100
Chart No: 5.1.11 Opinion regarding the satisfaction level of the existing training program by TVS TS:
Inference: The above table clearly shows that 51.3% of the respondents are highly satisfied , 48 % of the respondents are satisfied and 0.7% are dissatisfied with the existing training program.
Table No: 5.1.12 Candidate’s opinion about the job before the training program: S.No 1 2 3 4 5
Options Very easy Easy to large extent Easy to some extent Not so easy Difficult Total
No of Respondents 5
Percentage (%) 3.3
10
6.7
56 49 30 150
37 33 20 100
Chart No: 5.1.12 Candidate’s opinion about the job before the training program:
Inference: The above table clearly shows that 37% of the respondents feel that the job is easy to some extent,33 % of the respondents feels that the job is not so easy, 20% of the respondents feels that the job is difficult and only 6.7% of the respondents feel that the job is easy to large extent before the training program.
Table No: 5.1.13 Candidate’s opinion about the job after the training program: S.No 1 2 3 4 5
Options Very easy Easy to large extent Easy to some extent Not so easy Difficult Total
No of Respondents 66
Percentage (%) 44
59
39
25 0 0 150
17 0 0 100
Chart No: 5.1.13 Candidate’s opinion about the job after the training program:
Inference: The above table clearly shows that 37% of the respondents feel that the job is very easy,39 % of the respondents feels that the job is easy to large extent, 17% of the respondents feels that the job is easy to some extent after the training program.
Table No: 5.1.14 Opinion regarding knowledge and skills acquired through the training program: S.No 1 2 3 4 5
Options To full extent To a very large extent To large extent To some extent Not at all Total
No of Respondents 35
Percentage (%) 23.3
59 45 11 0 150
39.3 30 7.33 0 100
Chart No: 5.1.14 Opinion regarding knowledge and skills acquired through the training program:
Inference: The above table clearly shows that 39.3 % of the respondents acquired knowledge and skills to a very large extent, 30% of the respondents acquires to a large extent, 23.3 %of the respondents acquired to a full extent and only 7.33% of the respondents acquired knowledge and skill to some extent.
Table No: 5.1.15 Feedback about the aspects of training: Table No: 5.1.15.1 Feedback about the trainer S.No 1 2 3 4 5
Training Faculty Very Good Good Average Bad Very bad Total
No of Respondents
Percentage (%)
100 50 0 0 0 150
67 33 0 0 0 100
Chart No: 5.1.15.1 Feedback about the Trainer
Inference: The above table shows that 67% of the respondents feel that the trainer was very good and 33% of the respondents feel the training faculty are good.
Table No: 5.1.15.2 Feedback about the Course content: S.No 1 2 3 4 5
Course content Very Good Good Average Bad Very bad Total
No of Respondents
Percentage (%)
62 83 5 0 0 150
41.34 55.33 3.33 0 0 100
Chart No: 5.1.15.2 Feedback about the Course content:
Inference: The above table shows that 41.34% of the respondents feel that the course contents are very good , 55.33% of the respondents feel the course contents are good and 3.33% are average.
Table No: 5.1.15.3 Feedback about the course material: S.No 1 2 3 4 5
Course Material Very Good Good Average Bad Very bad Total
No of Respondents
Percentage (%)
59 76 15 0 0 150
39.33 50.67 10 0 0 100
Chart No: 5.1.15.3 Feedback about the course material:
Inference: The above table shows that 39.33% of the respondents feel that the course material are very good , 50.67% of the respondents feel the course material are good and 10% are average.
Table No: 5.1.15.4 Feedback about Discussion/ Exercise/ Case study: S.No 1 2 3 4 5
Discussions Very Good Good Average Bad Very bad Total
No of Respondents 70 66 14 0 0 150
Chart No: 5.1.15.4 Feedback about Discussion/ Exercise/ Case study:
Percentage (%) 46.67 44 9.33 0 0 100
Inference: The above table shows that 46.67% of the respondents feel that the discussion & exercise are very good , 44% of the respondents feel the discussion & exercise are good and 3.33% are average.
Table No: 5.1.15.5 Feedback about the Venue Arrangements: S.No 1 2 3 4 5
Arrangements Very Good Good Average Bad Very bad Total
No of Respondents 58 72 20 0 0 150
Chart No: 5.1.15.5 Feedback about the Venue Arrangements:
Percentage (%) 38.67 48 13.33 0 0 100
Inference: The above table shows that 48% of the respondents feel the arrangements are good , 38.67% are very good and 13.33% of arrangements are average.
Table No: 5.1.16 Opinion about the Opportunities giving for suggestion: S.No 1 2
Options Yes No Total
No of Respondents 150 0 150
Chart No: 5.1.16 Opinion about the Opportunities for suggestion:
Percentage (%) 100 0 100
Inference: The above table shows that 100% of the respondents are given opportunities during the training for giving suggestions.
Table No: 5.1.17 Opinion about the recommendation of training to the other employees: S.No 1 2
Options Yes No Total
No of Respondents 148 2 150
Percentage (%) 98.67 1.33 100
Chart No: 5.1.17 Opinion about the recommendation of training to the other employees:
Inference: The above table show that 98.67% of the respondents will recommend this training for others and 1.33% only will not recommend this training to others.
Table No: 5.1.18 Opinion regarding superior guidance during the training program. S.No 1 2 3 4 5
Options Strongly agree Agree Disagree Strongly disagree Neither agree nor disagree Total
No of Respondents 51 99 0 0
Percentage (%) 34 66 0 0
0 150
0 100
Chart No: 5.1.18 Opinion regarding superior guidance during the training program
Inference: The above table shows that 66% of the respondents agrees that they get guidance from their superiors during the training and 34% did not get guidance from their superior.
Table No: 5.1.19 Opinion regarding the relationship between trainer and trainee No of S.No Options Respondents 1 Strongly agree 94 2 Agree 56 3 Disagree 0 4 Strongly disagree 0 Neither agree nor 5 disagree 0 Total 150 Chart No: 5.1.19
Percentage (%) 63 37 0 0 0 100
Opinion regarding the relationship between trainer and trainee
Inference: The above table shows that 63% of the respondents strongly agree the relationship is good between trainer & trainee and 37% just agree the relationship is good between trainer & trainee.
Table No: 5.1.20 Feedback about the training: S.No 1 2 3 4 5
Options Very Good Good Average Poor Very poor Total
Chart No: 5.1.20 Feedback about the training:
No of Respondents 71 77 2 0 0 150
Percentage (%) 47.33 51.33 1.3 0 0 100
Inferences: The above table show that 51.33% of the respondents feel good about the training and 47.33% of the respondents feel very good about the training.
Table No: 5.1.21.1 Opinion of the candidates about the following attributes: Extent of attitude acquired by the respondents - Knowledge: No of Percentage S.No Options Respondents (%) 1 To full extent 57 38 To a very large 2 extent 63 42 3 To large extent 30 20 4 To some extent 0 0 5 Not at all 0 0 Total 150 100 Chart No: 5.1.21.1 Knowledge:
Inference The above table shows that 42% respondents gains knowledge to a large extents , 38% of the respondents gains knowledge to full extents and 20% of the respondents gains to large extents.
Table No: 5.1.21.2 Extent of attitude acquired by the respondents - Efficiency: S.No 1 2 3 4 5
Options To full extent To a very large extent To large extent To some extent Not at all Total
Chart No: 5.1.21.2 Efficiency:
No of Respondents 39
Percentage (%) 26
73 38 0 0 150
48.67 25.33 0 0 100
Inference The above table shows that 48.67% respondents gains efficiency to a large extents , 26% of the respondents gains efficiency to full extents and 25.33% of the respondents gains to large extents.
Table No: 5.1.21.3 Extent of attitude acquired by the respondents - Skills No of Percentage S.No Options Respondents (%) 1 To full extent 49 32.67 To a very large 2 extent 63 42 3 To large extent 35 23.33 4 To some extent 0 0 5 Not at all 0 0 Total 150 100 Chart No: 5.1.21.3 Skills
Inference The above table shows that 42% respondents gains skills to a large extents , 32.67% of the respondents gains skills to full extents and 23.33% of the respondents gains to large extents
Table No: 5.1.21.4 Extent of attitude acquired by the respondents - Communication Skill: No of Percentage S.No Options Respondents (%) 1 To full extent 59 39.33 To a very large 2 extent 60 40 3 To large extent 30 20 4 To some extent 1 0.67 5 Not at all 0 0 Total 150 100 Chart No: 5.1.21.4 Communication Skill:
Inference: The above table shows that 40% respondents has developed communication skill to a very large extents ,39.33% of the respondents has developed communication to full extents and 20% of the respondents gains to large extents
Table No: 5.1.21.5 Extent of attitude acquired by the respondents - Team Work: S.No 1 2 3 4 5
Options To full extent To a very large extent To large extent To some extent Not at all Total
Chart No: 5.1.21.5 Team Work:
No of Respondents 59
Percentage (%) 39.33
63 25 3 0 150
42 16.67 2 0 100
Inference: The above table shows that 42% respondents has developed team work skill to a very large extents ,39.33% of the respondents has developed team work skill to full extents and 16.67% of the respondents developed to large extents
Table No: 5.1.22 Opinion about the effectiveness of training: No of S.No Options Respondents 1 Strongly agree 66 2 Agree 84 3 Disagree 0 4 Strongly disagree 0 Neither agree nor 5 disagree 0 Total 150 Chart No: 5.1.22 Opinion about the effectiveness of training:
Percentage (%) 44 56 0 0 0 100
Inference: The above table shows that 56% of the respondents agree the training should be more effective and 44% of the respondents strongly the training should be more effective from the present level.
5.2 WEIGHTED AVERAGE METHOD 5.2.1 CANDIDATES’ FEEDBACK ON THE VARIOUS ASPECTS OF THE TRAINING PROGRAM Very
Very
Description
good
Good
Average Bad
bad
Training faculty
100
50
0
0
0
Course content
62
83
5
0
0
Course material 59 Discussions/Exercise/Case
76
15
0
0
study 70 Arrangements done for 58
66 72
14 20
0 0
0 0
training Very good = 5 Good
=4
Average
=3
Bad
=2
Very bad
=1
CALCULATION: Training faculty
= [(100*5)+(50*4)+(0*3)+(0*2)+(0*1)]/150 = 4. 67
Course content
= [(62*5)+(83*4)+(5*3)+(0*2)+(0*1)]/150 = 4.38
Course material = [(59*5)+(76*4)+(15*3)+(0*2)+(0*1)]/150 = 4.29 Discussion
= [(70*5)+(66*4)+(14*3)+(0*2)+(0*1)]/150 = 4.37
Arrangements
= [(58*5)+(72*4)+(20*3)+(0*2)+(0*1)]/150 = 4.25
Description
Weighted Average
Rank
Training faculty
4.66
1
Course content
4.38
2
Course material 4.29 Discussions/Exercise/Case
4
study 4.37 Arrangements done for
3
training
5
Interpretation:
4.25
From the above weighted average table it has been inferred that the majority of the respondents have given first preference to the Training Faculty, the second preference is given to Course content, the third preference is given to the Discussion, Exercise , Case study and fourth & fifth preference given to the course material & Arrangements done for the training respectively.
5.2.2 CANDIDATES OBTAINED FROM TRAINING PROGRAM: Full
Very
large Large
Some
Not at
Description
extent
extent
extent
extent
all
Knowledge
57
63
30
0
0
Efficiency
39
73
38
0
0
Skills Communication
49
63
35
0
0
skills
59
60
31
0
0
Team work
59
63
26
2
0
Very good = 5 Good
=4
Average
=3
Bad
=2
Very bad
=1
Calculation: Knowledge
= [(57*5)+(63*4)+(30*3)+(0*2)+(0*1)]/150 = 4.18
Efficiency
= [(39*5)+(73*4)+(38*3)+(0*2)+(0*1)]/15 = 4.00
Skills
= [(49*5)+(63*4)+(35*3)+(0*2)+(0*1)]/15 = 4.013
Communication skill = [(59*5)+(60*4)+(31*3)+(0*2)+(0*1)]/15 = 4.186 Team Work
= [(59*5)+(63*4)+(26*3)+(2*2)+(0*1)]/15 =4.19
Description
Weighted Average
Rank
Knowledge
4.18
3
Efficiency
4.00
5
Skills Communication
4.01
4
skills
4.186
2
Team work
4.19
1
INTERPRETATION: From the above weighted average table it has been inferred that the majority of the respondents have given first preference to the Team work , the second and third
preference is given to the communication skill and Knowledge , whereas the fourth and fifth preference given to the Skill and Efficiency respectively.
5.3 CHI - SQUARE ANALYSIS 5.3.1EXPERIENCE AND SATISFACTION LEVEL:
Highly
Satisfied
Neither
Dis
Highly
satisfied
satisfied nor
satisfied
Dissatisfied
<5years 5-10yrs 10-15 Above
10 12 8 11
12 38 22 14
dissatisfied 7 6 5 5
0 0 0 0
0 0 0 0
29 56 35 30
5yrs Total
41
86
0
0
150
23
Total
Hypothesis: Null Hypothesis (Ho): There is no significant association between the experience and satisfaction level of training program conducted in Shree Vari Multiplast India(p) Limited. Alternative Hypothesis (H1): There is a significant association between the experience and satisfaction level of training program conducted in Shree Vari Multiplast India(p) Limited .
Observed
Expected
Frequency (O) Frequency (E) 10 7.927 12 16.627 7 4.447 0 0 12 38 6 0 0 8 22 5 0 0 11 14
0 0 15.307 32.107 8.587 0 0 9.567 20.067 5.367 0 0 8.2 17.2
(O – E)
(O - E) 2
(O - E) 2 /E
2.073 -4.627 2.553
18.467 21.409 6.518
2.329 1.288 1.466
0 0 -3.307 5.893 -2.587 0 0 -1.567 1.933 -0.367 0 0 2.8 -3.2
0 0 10.936 34.727 6.692 0 0 2.455 3.736 0.135 0 0 7.84 10.24
0 0 0.714 1.082 0.779 0 0 0.257 0.186 0.025 0 0 0.956 0.595
5 0 0
4.6 0.4 0 0 0 0 Calculated χ2 value
0.16 0 0
0.035 0 0 9.712
Degree of freedom :( c-1) (r-1) = (5-1) (4-1) =12 d. f at 5% level of significance Tabular Value = 21.026 Tabulated value is greater than the calculated value. RESULT: Since the tabulated value is greater than calculated value we accept null hypothesis. That is there is no significant association between the experience and satisfaction level of training program conducted in Shree Vari Multiplast India(p) Limited. 5.4 KARL – PEARSON’S COEFFICIENT OF CORRELATION:
OBJECTIVE: To identify the relationship between relevance & helpfulness of training and satisfaction on training. Strongly
Attributes
Agree
Strongly Agree
Neutral
Disagree
disagree
Total
Training(X) 78 Satisfaction on Training
67
4
0
1
150
(Y)
72
0
1
0
150
Relevancy
X
of
77 Y
(X-X)
Y-Y
(X-X)(Y- (X-X)2
(Y-Y)2
Y) 78
77
-48
-47
2256
2304
2209
67
72
-37
-42
1554
1369
1764
4
0
26
0
0
676
0
0
1
0
29
0
0
841
1
0
29
0
0
841
0
150
150
-30
-60
3810
5190
4814
X= ∑x/n = 150/5=30 Y= ∑y/n= 150/5=30 ∑(x-x) (y-y)
Ϭxy =-----------------------√∑(x-x) 2 √∑(y-y) 2 = 3810/ √5190*√4814 = 3810/4995.36 r = 0.763 Inference: The coefficient of correlation inferred that r = 0.763 is positive correlated, thus there is relationship between relevance & helpfulness of training and satisfaction on training.
6. FINDINGS:
From the study it is inferred that the maximum number of respondents, 83% belongs to the age of 25 to 30 years , 15% of the respondents belong to the age group of 31 to 35 years and 2% belong to the age of 36 to 40 years.
From the study it has been found that the maximum number of respondents, 74% belongs to the below 5 years of experience and 11.3% of the respondents belong to the 5 to 10 years of experiences and 14% of the respondents belong to the 10 to 15 years .
The study demonstrates that maximum of the respondents are satisfied and few of the candidates stand neutral.
From the study it is inferred that maximum of the respondents feel that the duration is too long.
The study shows that 48% of the respondents feel the arrangements are good , 38.67% are very good and 13.33% of arrangements are average.
From the study it is inferred that more than 50 % of the respondents feel good about the training and less than half of the total respondents feel very good about the training.
The study demonstrate that maximum of the respondents agree the training should be more effective and mast of the respondents strongly the training should be more effective from the present level.
From the study it is inferred that 63% of the respondents strongly agree the relationship is good between trainer & trainee and 37% just agree the relationship is good between trainer & trainee.
7. SUGGESTIONS:
There should be more personality based programs it helps the individual in overall development.
To familiarize workers about the concept of leadership introduces to him leadership traits and their application.
Subject methods should be discussed thoroughly, in detail and both sextensively and intensively.
Homogenous groups should be formed for training so that they can easily and quickly understand each other’s problems.
8. CONCLUSION: Training and Development helps in optimizing the utilization of human resource and it helps to provide an opportunity and broad structure for the development of human resource technically and behavioral skills in an organization. It also helps the employee in attaining personal growth and increasing the job knowledge and skill of employees at each level. Further helps the employee to achieve organizational goals as well as their individual goals. The trainee who attended training program in Shree Vari MultiPlast India(p) limited was highly satisfied. The institution should not stop with the existing level of satisfaction because the growth of any organization depends on continuous improvement. By doing this the company can attain long term success, increase in revenue and to develop further.
9. ANNEXURE BIBLOGRAPHY Mamoria C.B:“Personnel Management” Himalaya Publishing House, Mumbai 2002. Subba Rao P: “Personnel / Human Resource Management” Konark Publication Pvt, Ltd. Delhi 1998 Tripathi .P.C: “Human Resource Development” Sultan Chand & Sons, Delhi, 2003. C.R. Kothari : “Research Methodology” New age edition, 2002 WEBSITE: www.vvnational.com www.citehr.com www.pdfcoke.com
QUESTIONNAIRE Name: ______________________________________________ Emp No: __________________ Age:
25-30
Experience:
< 5 Years
Income:
Rs.10000
31-35
36-40
5-10 Years Rs.20000
>40
10-15years
>5 Years
Rs.30000
Rs.40000
Name of the Organization:
1. Have you undergone any training in your organization? Yes
No
2. Duration of the training ___________________________ 3. Mention the satisfaction level of the training given by your organization Highly satisfied
Satisfied
Neutral
Dissatisfied
Highly dissatisfied 4. Please mention the method of training given in your Organization. On the job
Off the job
Job rotation
Vestibule
Coaching
Role playing
Job instruction
Conference
Training through step by step
Discussion
Committee assignment
Instruction
6. Who suggested the need of the training in Shree Vari Multiplast India(P) Limited? Superior
Company
Others
7. What do you feel about duration of the training? Too long
Too short
Just enough
8. The training was more relevant and helpful Strongly agree
Agree
Neutral
Disagree
Strongly disagree 9. Give your satisfaction level on the existing training . Highly satisfied Dissatisfied
Satisfied
Neutral
Highly dissatisfied
10. How did you feel the job before the training ? Very easy
Easy to large extent
Not so easy
Difficult
Easy to some extent
11. How did you feel the job after the training ? Very easy
Easy to large extent
Not so easy
Difficult
Easy to some extent
12. To what extent you have acquired the knowledge and skills through the training ? To the full extent
To a very large extent
To some extent
Not at all
To a large extent
13. Please give your sincere feedback on the following aspects of the training S.No
Description
Very
Good
Average
Bad
good 1 2 3 4
Training Faculty Course content Course materials Discussions/Exercise/Case
5
study Arrangements done for
bad
training 14. I get guidance from my superior while training Strongly agree
Agree
Disagree
Strongly disagree
Neither agree nor disagree 15. Trainer maintains a good relationship with Trainee Strongly agree
Agree
Neither agree nor disagree
Disagree
Very
Strongly disagree
16. I get opportunities to give suggestions/express the views about the training that I have undergone Yes
No
17. I will recommend this training to others in my organization Yes
No
18. To what extent you have acquired the following attributes due to the training Attributes
Full
Very large Large
Some
extent
extent
extent
extent
Not at all
Knowledge Efficiency Skills Communication Skills Team work Confidence 19. Overall feedback about the training Very good
Good
Average
Not good
20. I found the training to be more effective Strongly Agree
Agree
Neither agree nor disagree 21. Any other suggestion/comments?
Disagree
Strongly disagree
Related Documents

A Study On Training And Development
August 2019 24
A Study On Training N Development
June 2020 4
Training And Development
November 2019 32
Training And Development
November 2019 30
Training And Development
June 2020 15
Training And Development 3
May 2020 17More Documents from ""
Project.docx
August 2019 18
A Study On Training And Development
August 2019 24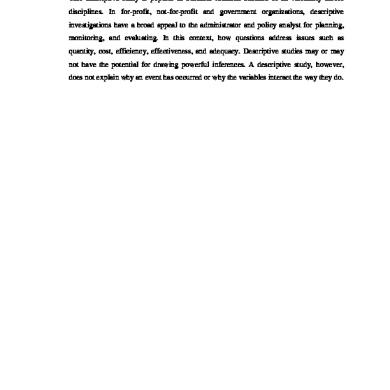
Resea.docx
August 2019 19
Shankar.docx
August 2019 9
501-block-1.pdf
December 2019 32